Fig. 1.
Download original image
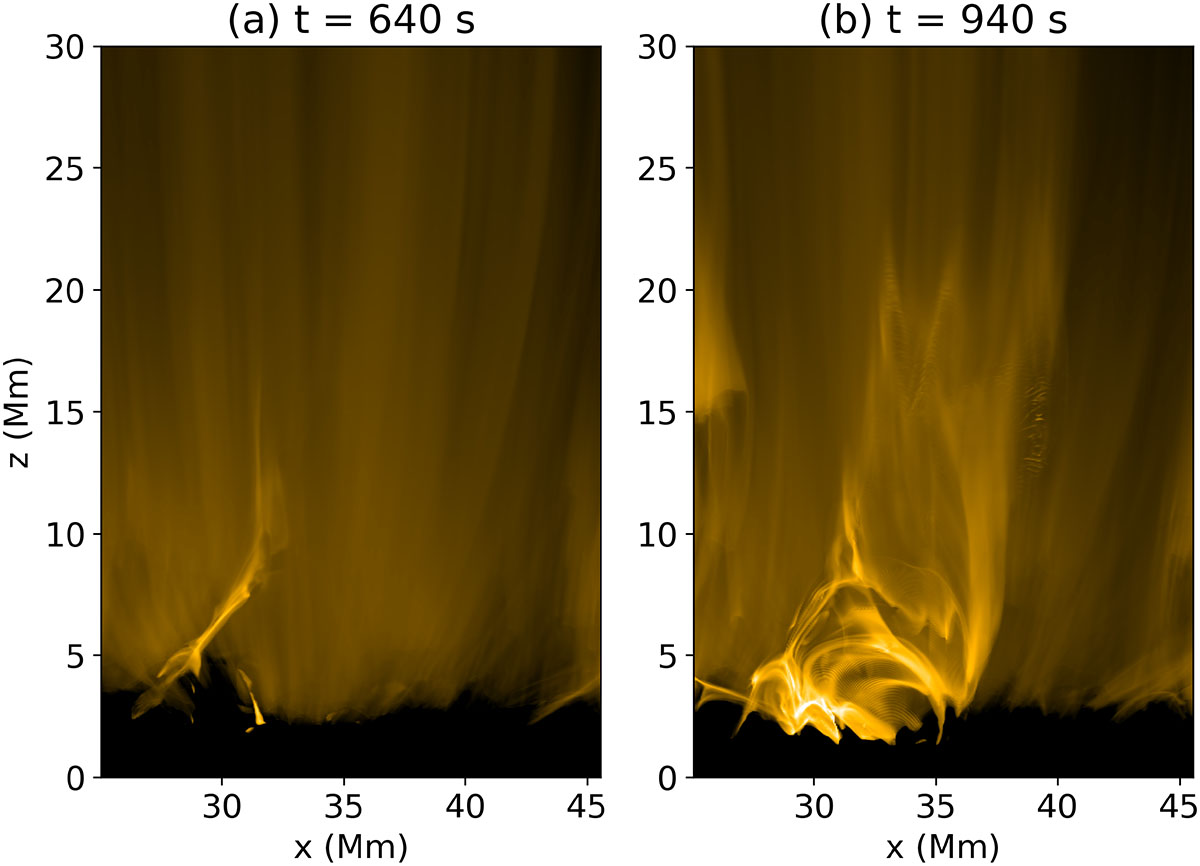
Extreme UV images synthesized from a small region of the model showing two stages of the jet. Panel (a): Standard-jet phase. Panel (b): Same as panel (a) but five minutes later when the jet transitioned into the blowout-jet phase. Both images show the emission in the EUI 174 Å passband integrated along the y-axis. This represents a view at or near the solar limb of plasma at temperatures around 1 MK. See Sect. 3.1.
Current usage metrics show cumulative count of Article Views (full-text article views including HTML views, PDF and ePub downloads, according to the available data) and Abstracts Views on Vision4Press platform.
Data correspond to usage on the plateform after 2015. The current usage metrics is available 48-96 hours after online publication and is updated daily on week days.
Initial download of the metrics may take a while.