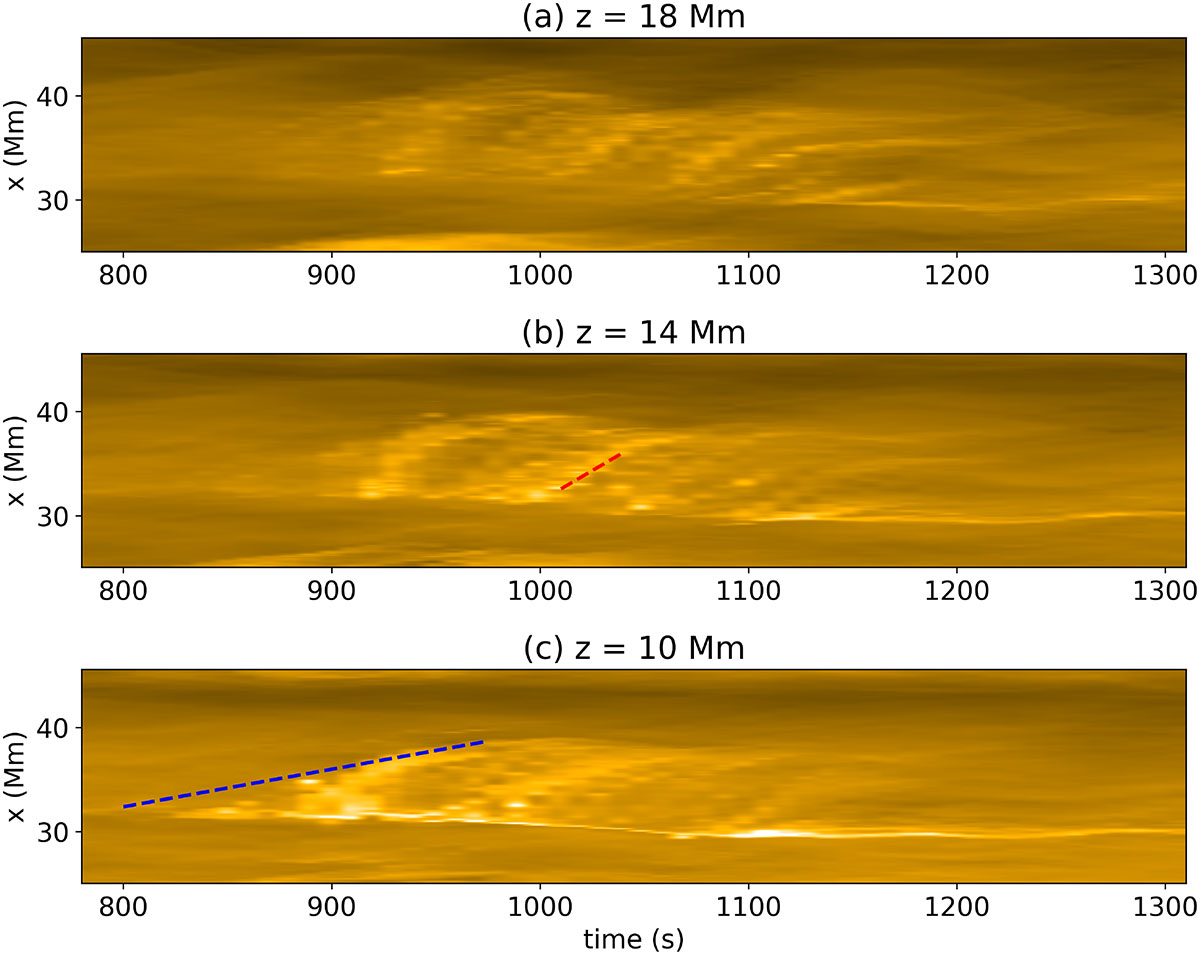
Fig. 3.
Download original image
Space-time diagrams across the jet spire at different heights. These represent the temporal evolution at a horizontal line along the x-direction placed within the jet spire. Panels (a)–(c) show the evolution at heights of 18, 14, and 10 Mm above the surface. The sloped red and blue lines in panels (b) and (c) indicate apparent speeds of 116 km s−1 (red) and 36 km s−1 (blue). See Sect. 3.1 for details.
Current usage metrics show cumulative count of Article Views (full-text article views including HTML views, PDF and ePub downloads, according to the available data) and Abstracts Views on Vision4Press platform.
Data correspond to usage on the plateform after 2015. The current usage metrics is available 48-96 hours after online publication and is updated daily on week days.
Initial download of the metrics may take a while.