Fig. 4.
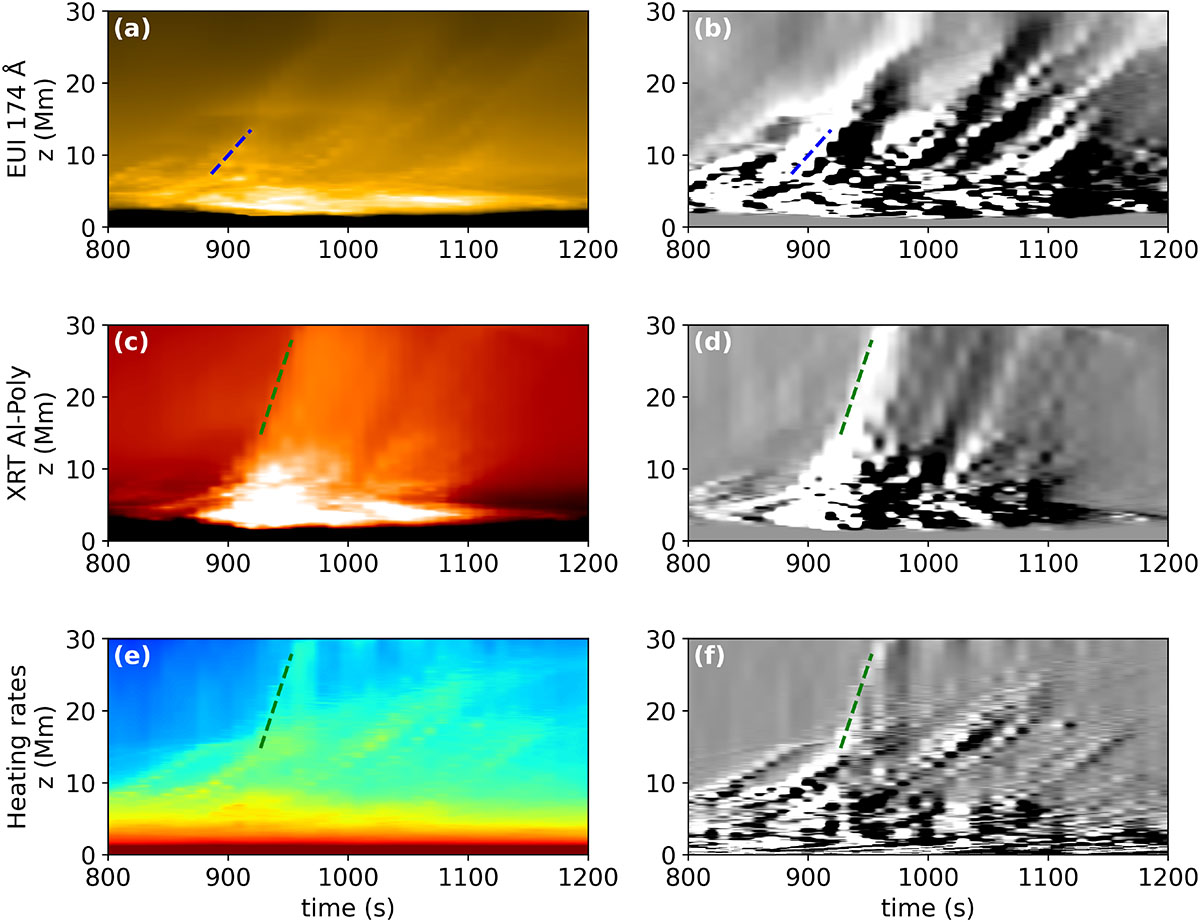
Download original image
Space-time diagrams along the vertical direction. These show the horizontally averaged vertical profile of the respective quantity as a function of time. From top to bottom: Evolution in EUI 174 Å (a–b), Hinode/XRT (c–d), and in heating rate (e–f). Left: Original value of the emissivity (a, c) and heating rate (e). Right: Respective running difference images (with a time delay of 10 s) simply to highlight the temporal changes. The dashed lines indicate apparent speeds of 184 km s−1 (a–b) and 504 km s−1 (c–f). See Sect. 3.1.
Current usage metrics show cumulative count of Article Views (full-text article views including HTML views, PDF and ePub downloads, according to the available data) and Abstracts Views on Vision4Press platform.
Data correspond to usage on the plateform after 2015. The current usage metrics is available 48-96 hours after online publication and is updated daily on week days.
Initial download of the metrics may take a while.