Fig. 5.
Download original image
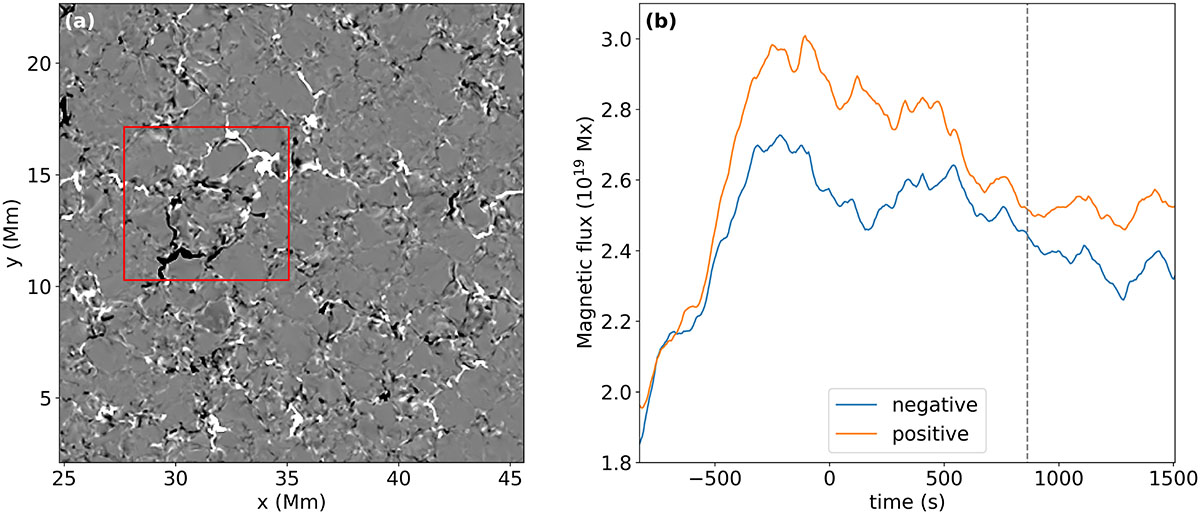
Temporal evolution of the vertical magnetic-field component in the photosphere beneath the jet. (a) Zoomed-in FOV of the magnetogram beneath the jet. (b) Sums of the absolute values of positive (orange curve) and negative (blue curve) polarities in the red box outlined in (a). The vertical dashed gray line indicates the time of the magnetogram shown in (a). An animation is available online. See Sect. 3.2.
Current usage metrics show cumulative count of Article Views (full-text article views including HTML views, PDF and ePub downloads, according to the available data) and Abstracts Views on Vision4Press platform.
Data correspond to usage on the plateform after 2015. The current usage metrics is available 48-96 hours after online publication and is updated daily on week days.
Initial download of the metrics may take a while.