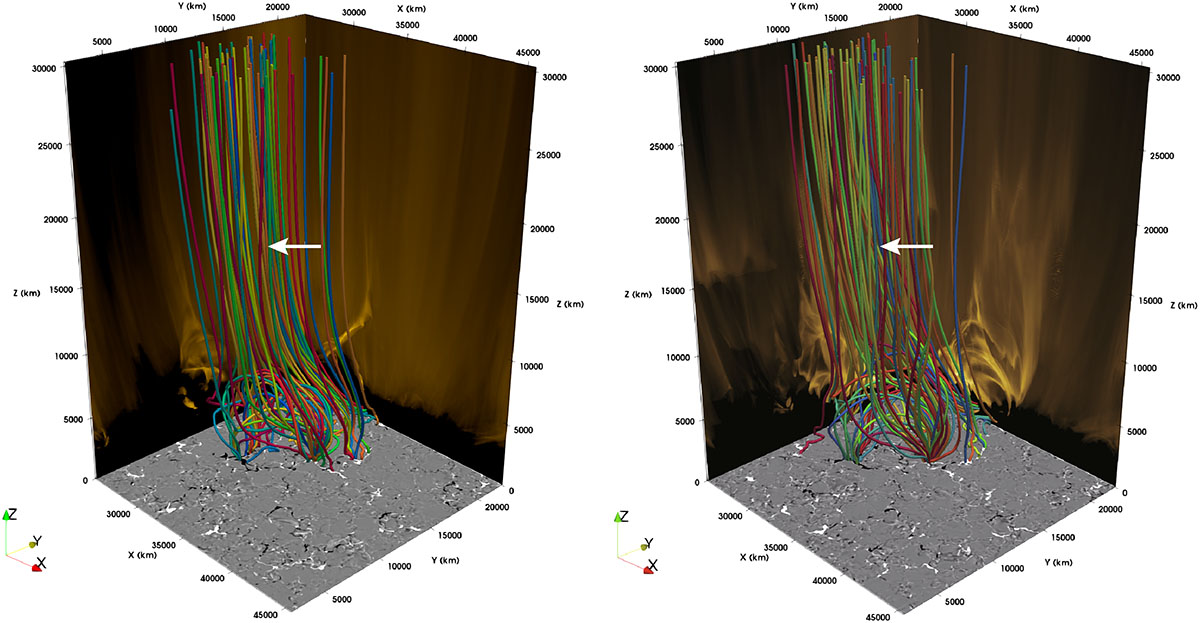
Fig. 6.
Download original image
Magnetic-field structure surrounding the jet. Left to right: Standard- and blowout-jet phases at the same times as in Fig. 1. In each panel the bottom shows a zoom-in of the magnetogram at the respective time. The synthesized EUI 174 Å images integrated over the x- and y-directions are depicted in the vertical slices of each 3D box. The colored lines represent the magnetic-field lines in and around the jet. The white arrows point to field lines in the jet spire that become misaligned during the blowout-jet phase, compared to the more aligned configuration during the standard phase. This indicates the untwisting motions likewise visible in the EUI 174 Å images on the vertical slices of the animation showing the temporal evolution. The animation is available online. See Sect. 3.2.
Current usage metrics show cumulative count of Article Views (full-text article views including HTML views, PDF and ePub downloads, according to the available data) and Abstracts Views on Vision4Press platform.
Data correspond to usage on the plateform after 2015. The current usage metrics is available 48-96 hours after online publication and is updated daily on week days.
Initial download of the metrics may take a while.