Fig. 3.
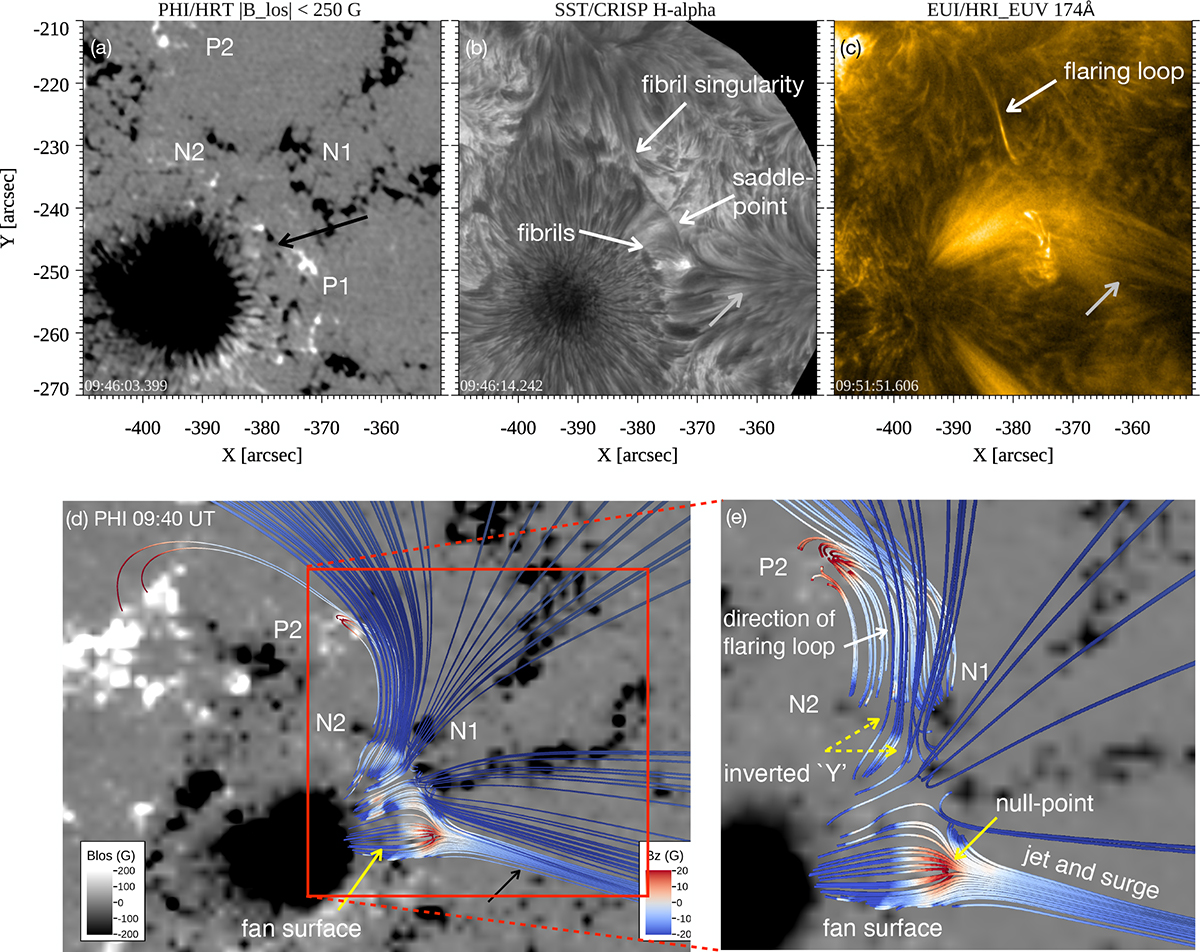
Download original image
Zoomed-in view of the area outlined by the white box in Fig. 2. A strong moat flow is observed near the jet base and is marked with a black arrow in panel a. Four main positive- and negative-polarity patches are labelled as P1, P2, N1, and N2 respectively. The blow-out jet in the coronal EUV 174 Å image, associated with a chromospheric surge in Hα, is indicated with grey arrow in panels b and c. Fibrils and the ‘X’-shaped saddle-point structure are marked in the Hα image. A flaring loop associated with the chromospheric fibril singularity is shown in EUI and Hα. Potential-field extrapolations on the PHI magnetogram are shown in panels d–e. In panel d, the yellow arrow indicates the jet base, which consists of a fan-spine configuration with a null point and associated outer spine towards the west (black arrow). A zoomed-in version is shown in panel e, where several inverted ‘Y’ structures are shown from the weak magnetic corridor between N1 and N2.
Current usage metrics show cumulative count of Article Views (full-text article views including HTML views, PDF and ePub downloads, according to the available data) and Abstracts Views on Vision4Press platform.
Data correspond to usage on the plateform after 2015. The current usage metrics is available 48-96 hours after online publication and is updated daily on week days.
Initial download of the metrics may take a while.