Fig. 4.
Download original image
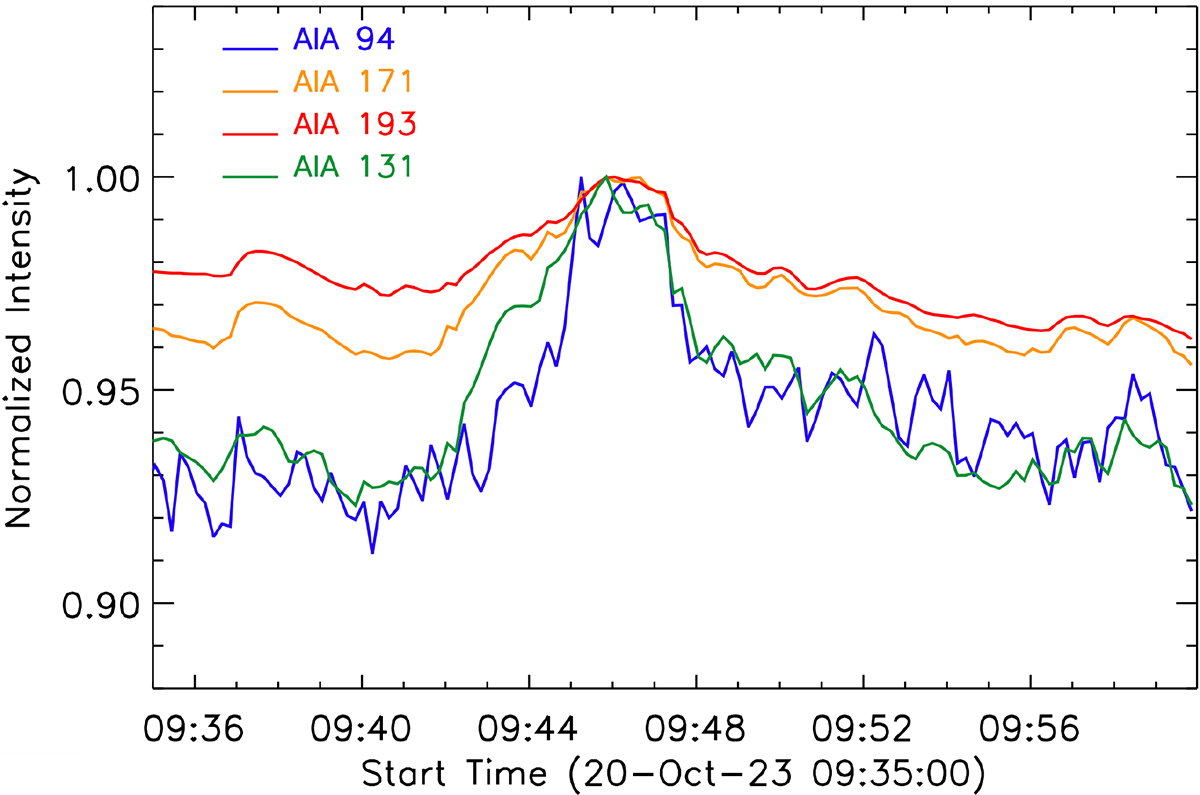
Intensity light curves at the flaring loop location in different AIA channels. The curves display a flare-like evolution, with a rapid heating phase that is most pronounced in the hotter channels, and a cooling phase after the peak around 09:46 UT that is slower in the cooler channels. The position of the box used to compute the intensity is indicated in Fig. A.1.
Current usage metrics show cumulative count of Article Views (full-text article views including HTML views, PDF and ePub downloads, according to the available data) and Abstracts Views on Vision4Press platform.
Data correspond to usage on the plateform after 2015. The current usage metrics is available 48-96 hours after online publication and is updated daily on week days.
Initial download of the metrics may take a while.