Fig. 5.
Download original image
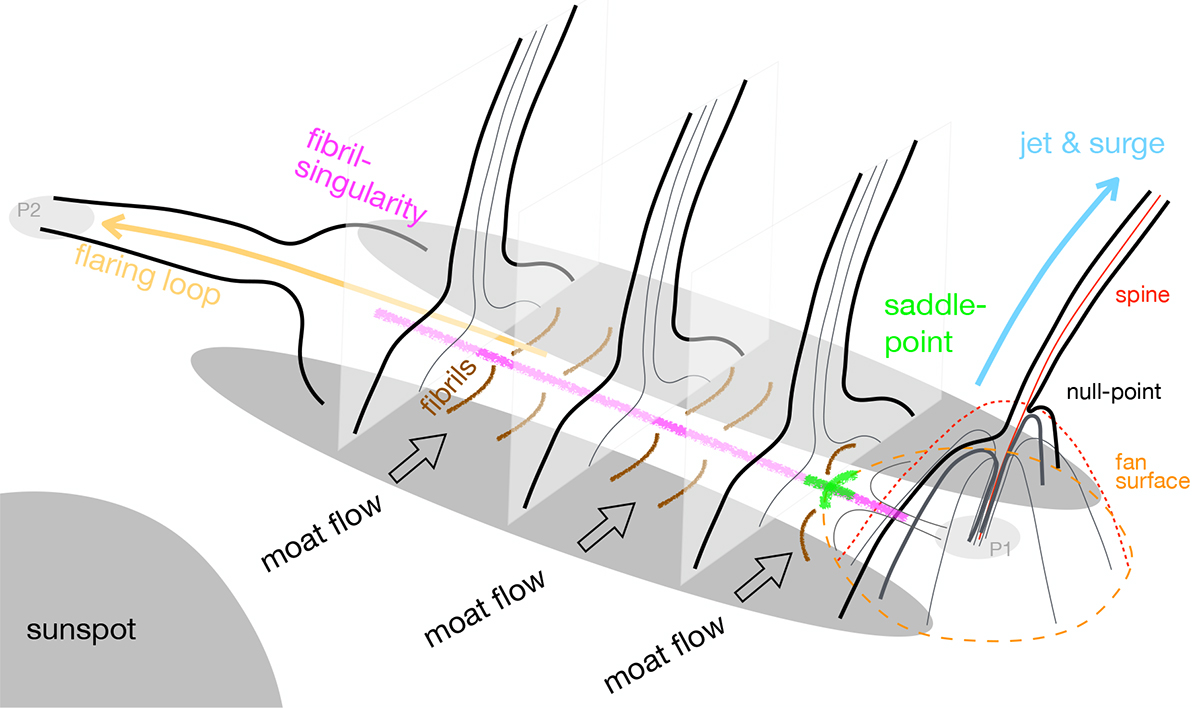
Schematic representation of the observations. The two colliding regions of negative polarity are overlaid with chromospheric fibrils, shown in brown. The flaring loop along the fibril singularity is indicated by a curved orange arrow pointing left. The fibril singularity line is shown in magenta, with a saddle point at one end indicated in green. A saddle point is shown at the boundary between fan surfaces and the fibril singularity. Multiple inverted ‘Y’ structures along the fibril singularity are illustrated with parallel black colour behind the main null-point structure at the jet base.
Current usage metrics show cumulative count of Article Views (full-text article views including HTML views, PDF and ePub downloads, according to the available data) and Abstracts Views on Vision4Press platform.
Data correspond to usage on the plateform after 2015. The current usage metrics is available 48-96 hours after online publication and is updated daily on week days.
Initial download of the metrics may take a while.