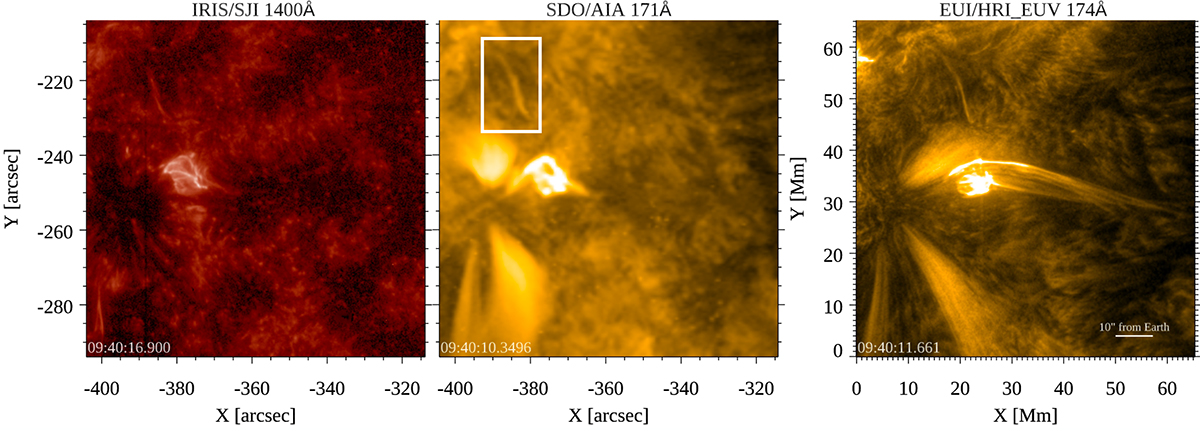
Fig. A.1.
Download original image
Blow-out jet at the time around maximum extent in IRIS SJI 1400 Å, AIA 171 Å, and EUI/HRIEUV 174 Å. The rectangular white box highlighted in the middle panel was used to compute the intensity variation presented in Fig. 4. The EUI image is shown without reprojection to the Earth viewing direction. An animation of this figure is available in the online material (AIA171+EUI+IRIS_2023-10-20_jet.mp4).
Current usage metrics show cumulative count of Article Views (full-text article views including HTML views, PDF and ePub downloads, according to the available data) and Abstracts Views on Vision4Press platform.
Data correspond to usage on the plateform after 2015. The current usage metrics is available 48-96 hours after online publication and is updated daily on week days.
Initial download of the metrics may take a while.