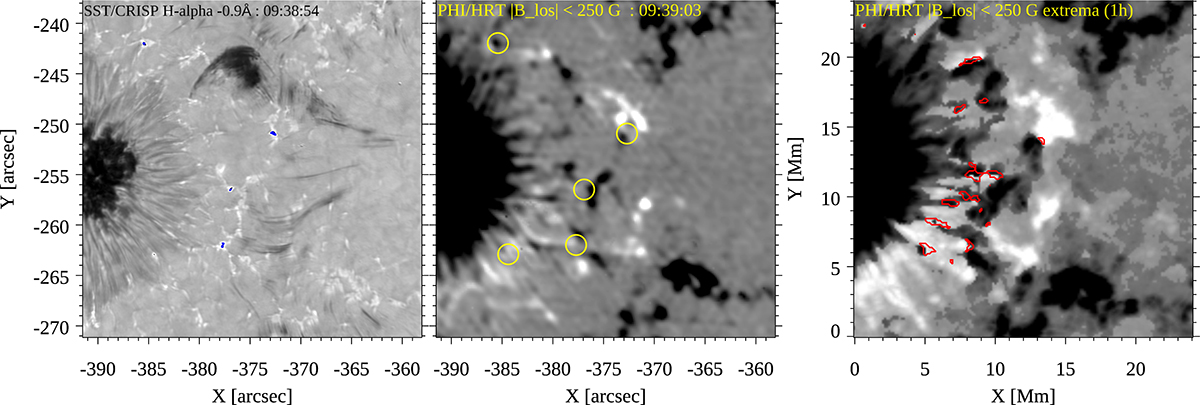
Fig. A.2.
Download original image
Reconnection regions and rapid motion of photospheric magnetic fields close to the sunspot. In Hα blue wing (left panel) the reconnection sites are outlined with blue contours, where enhanced Hα wing emission mark the location of Ellerman Bombs. The intensity at these locations is 1.45 times the intensity of the reference quiet Sun spectrum. The middle panel shows the cotemporal and aligned PHI BLOS map. Yellow circles mark the locations of these reconnection points. The right panel shows, at each pixel, the extremum of BLOS over 1 h before the onset of the jet generated from the original PHI data. Red contours mark pixels that have |BLOS|> 100 G for both polarities during the 1 h sequence.
Current usage metrics show cumulative count of Article Views (full-text article views including HTML views, PDF and ePub downloads, according to the available data) and Abstracts Views on Vision4Press platform.
Data correspond to usage on the plateform after 2015. The current usage metrics is available 48-96 hours after online publication and is updated daily on week days.
Initial download of the metrics may take a while.