Fig. A.4.
Download original image
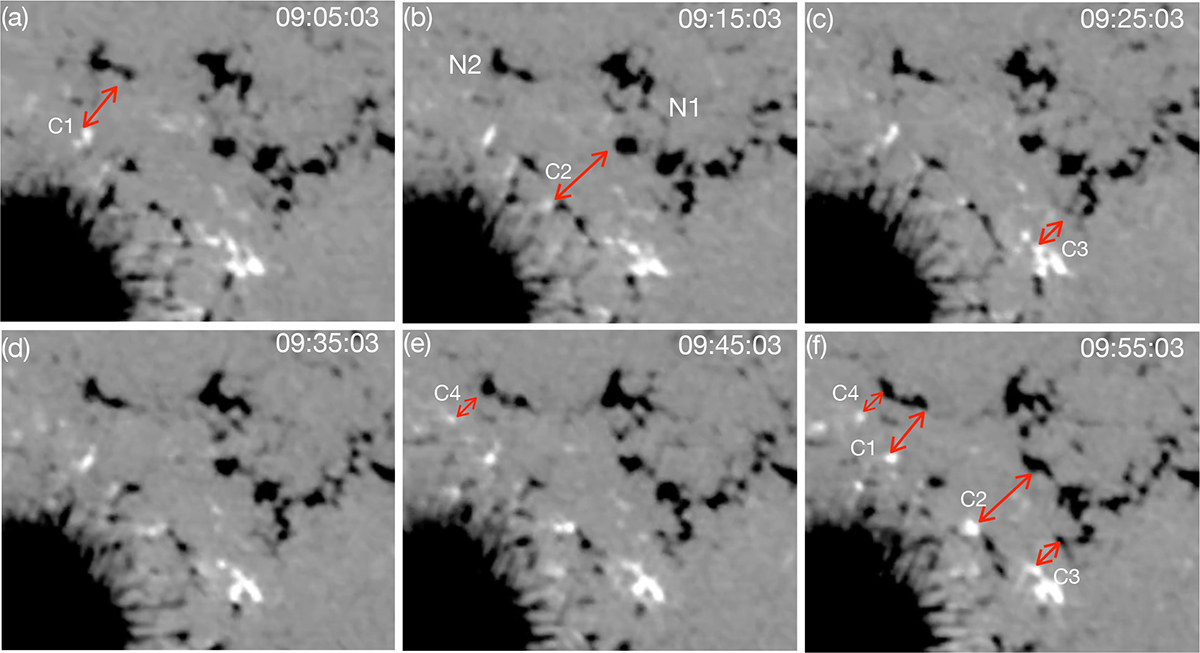
Evolution of the magnetic field BLOS from PHI observations in the region of interest near the large negative sunspot from 09:05 to 09:55 UT. Several magnetic polarities (labeled C1–C4) originate close to the sunspot. These polarities and the big negative N1-N2 show a motion towards each other over time. Four double-headed arrows are drawn in panel (f) such that the arrowheads touch two opposite-polarity patches. The same arrows are drawn on panels (a), (b), (c), and (e) for each of the C1–C4 patches. By comparing these panels with panel (f), it can be seen that the opposite polarities move closer to each other and magnetic flux convergence is increasing.
Current usage metrics show cumulative count of Article Views (full-text article views including HTML views, PDF and ePub downloads, according to the available data) and Abstracts Views on Vision4Press platform.
Data correspond to usage on the plateform after 2015. The current usage metrics is available 48-96 hours after online publication and is updated daily on week days.
Initial download of the metrics may take a while.