Fig. 1
Download original image
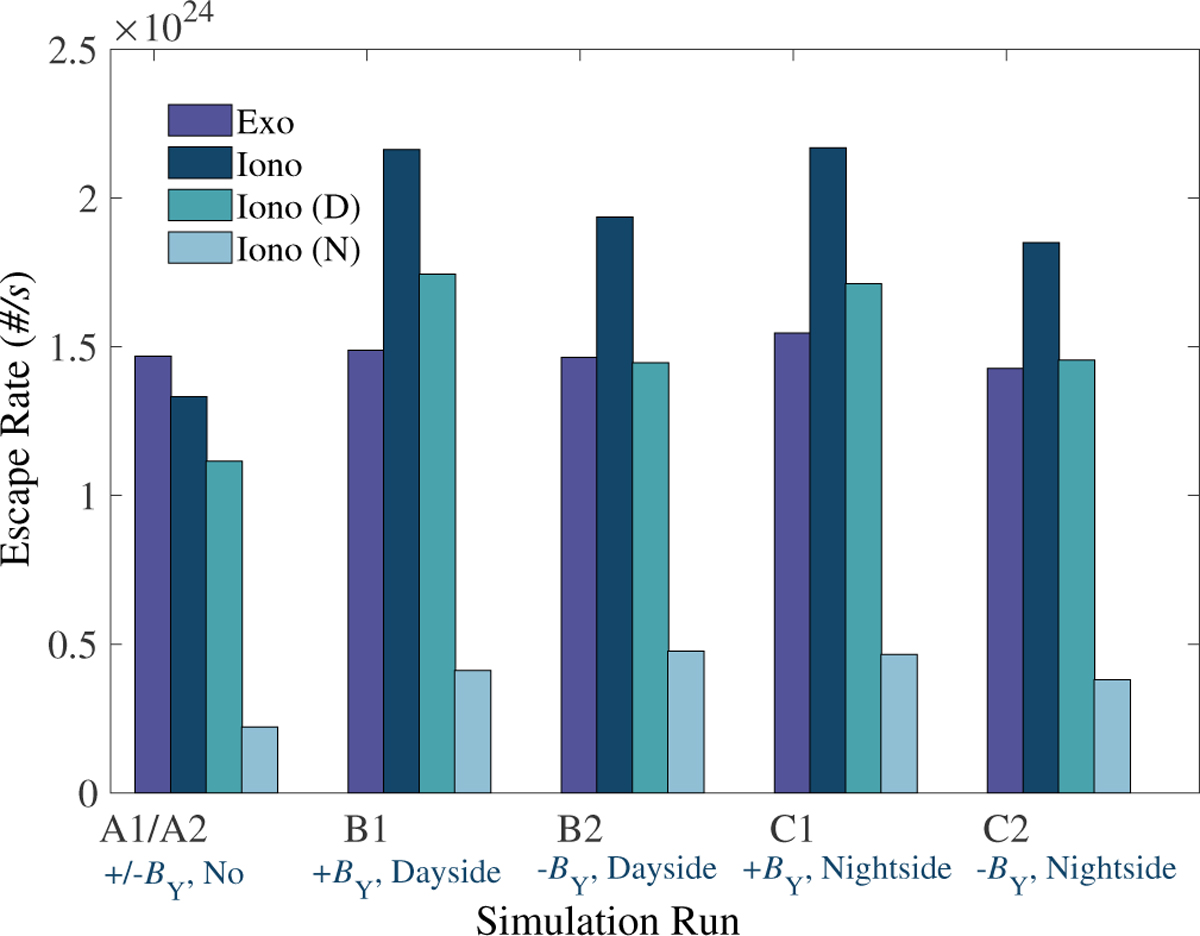
Histograms of oxygen ion escape rates in different simulation runs. The dark-purple and dark-cyan bars in each run refer to the escape rates of exospheric and ionospheric oxygen ions, respectively. The cadet-blue and sky-blue bars in each run denote the ionospheric oxygen ion escape rates originating from the dayside (“D”) and night-side (“N”) ionospheric source regions, respectively.
Current usage metrics show cumulative count of Article Views (full-text article views including HTML views, PDF and ePub downloads, according to the available data) and Abstracts Views on Vision4Press platform.
Data correspond to usage on the plateform after 2015. The current usage metrics is available 48-96 hours after online publication and is updated daily on week days.
Initial download of the metrics may take a while.