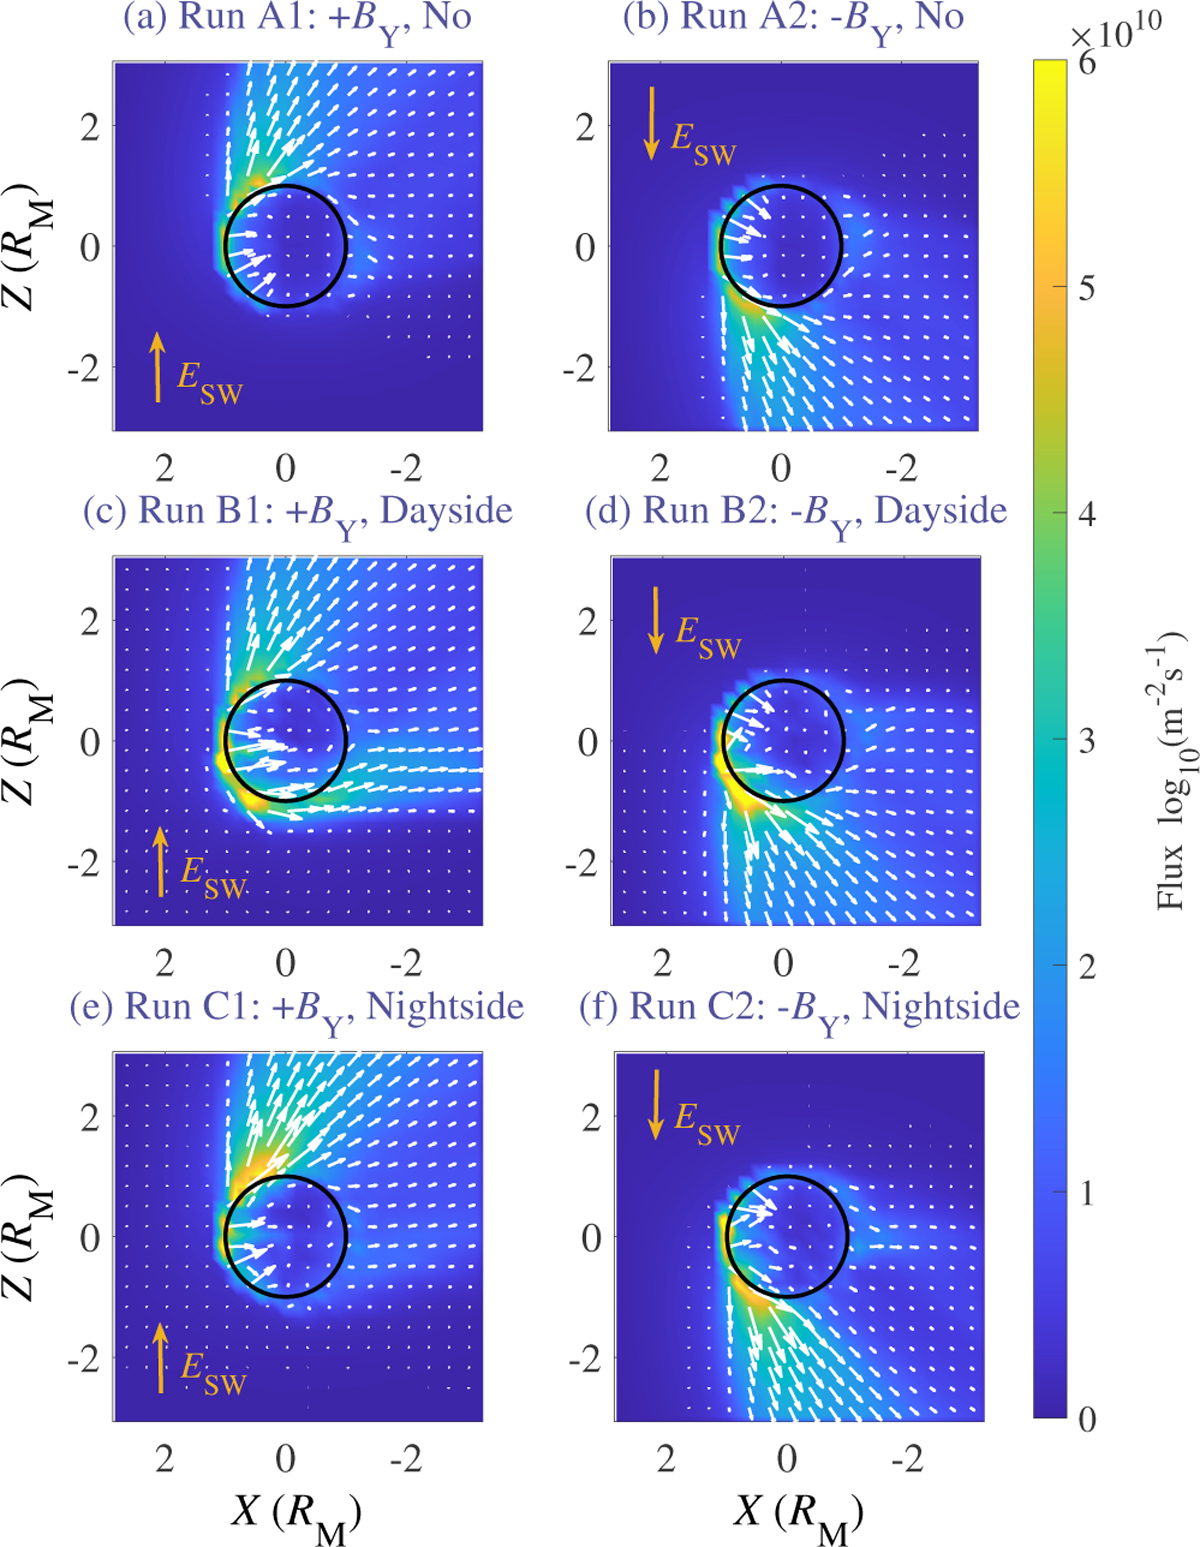
Fig. 2
Download original image
Oxygen ion flux distributions in the XZ plane for different simulation runs, averaged over −1.6 RM ≤ Y ≤ 1.6 RM. In each panel, the black circle represents Mars, the vertical yellow arrow on the left indicates the direction of the solar wind motional electric field (ESW), and the white arrows indicate the direction of the ionospheric oxygen ion flux, with arrow lengths proportional to the flux magnitude.
Current usage metrics show cumulative count of Article Views (full-text article views including HTML views, PDF and ePub downloads, according to the available data) and Abstracts Views on Vision4Press platform.
Data correspond to usage on the plateform after 2015. The current usage metrics is available 48-96 hours after online publication and is updated daily on week days.
Initial download of the metrics may take a while.