Fig. 3
Download original image
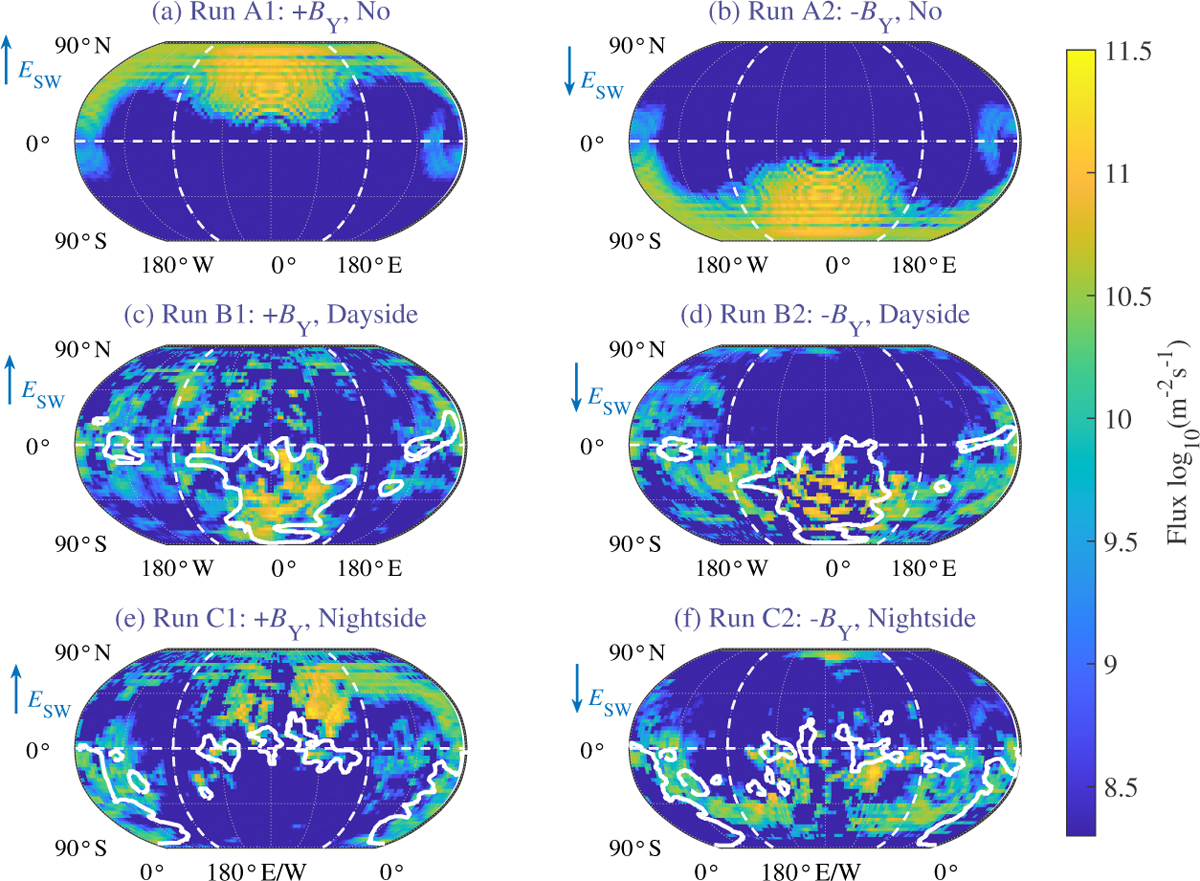
Distributions of the ionospheric oxygen ion escape fluxes in (a) Run A1, (b) Run A2, and the relative escape fluxes in (c) Run B1, (d) Run B2, (e) Run C1, and (f) Run C2 at the source region 400 km above the Martian surface. The solid white curves in each panel are contour lines of the crustal magnetic fields with a magnitude of 40 nT at the same altitude, and the vertical blue vector on the left shows the direction of the solar wind motional electric field (ESW).
Current usage metrics show cumulative count of Article Views (full-text article views including HTML views, PDF and ePub downloads, according to the available data) and Abstracts Views on Vision4Press platform.
Data correspond to usage on the plateform after 2015. The current usage metrics is available 48-96 hours after online publication and is updated daily on week days.
Initial download of the metrics may take a while.