Fig. 2
Download original image
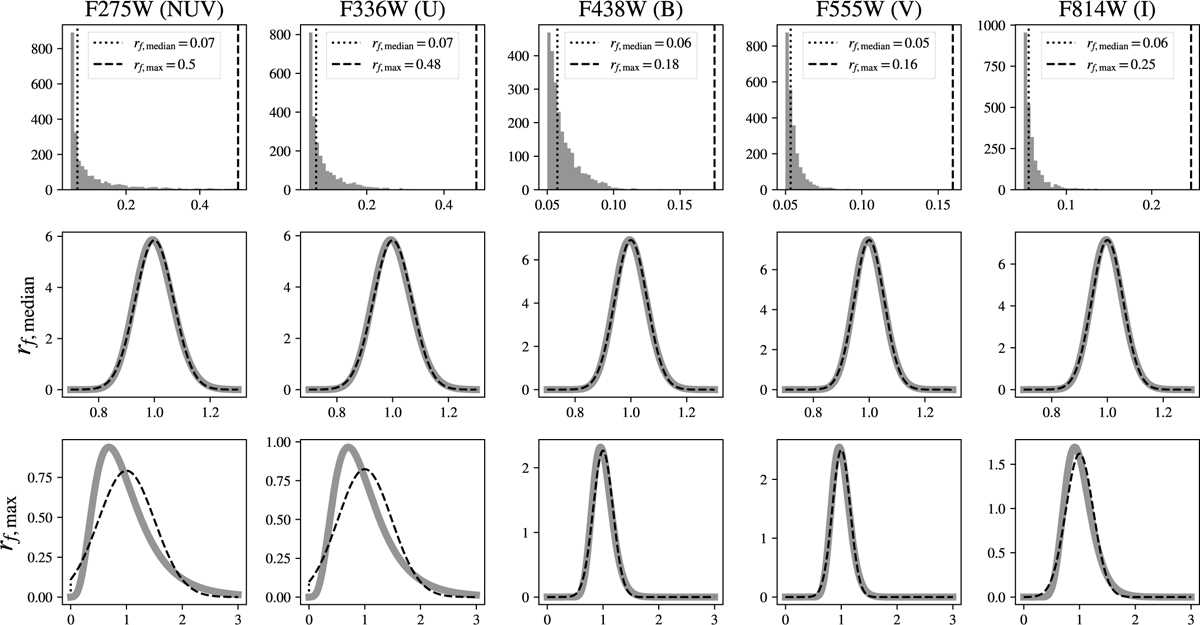
Top row: histograms of relative flux uncertainties in the PHANGS cluster catalog. The dotted vertical lines denote the median relative flux uncertainties, and the dashed lines denote the maximum relative flux uncertainties. Middle row: comparison of the normal noise model and the log-normal noise model for median relative flux uncertainties. Bottom row: comparison of the normal noise model and the log-normal noise model for maximum relative flux uncertainties.
Current usage metrics show cumulative count of Article Views (full-text article views including HTML views, PDF and ePub downloads, according to the available data) and Abstracts Views on Vision4Press platform.
Data correspond to usage on the plateform after 2015. The current usage metrics is available 48-96 hours after online publication and is updated daily on week days.
Initial download of the metrics may take a while.