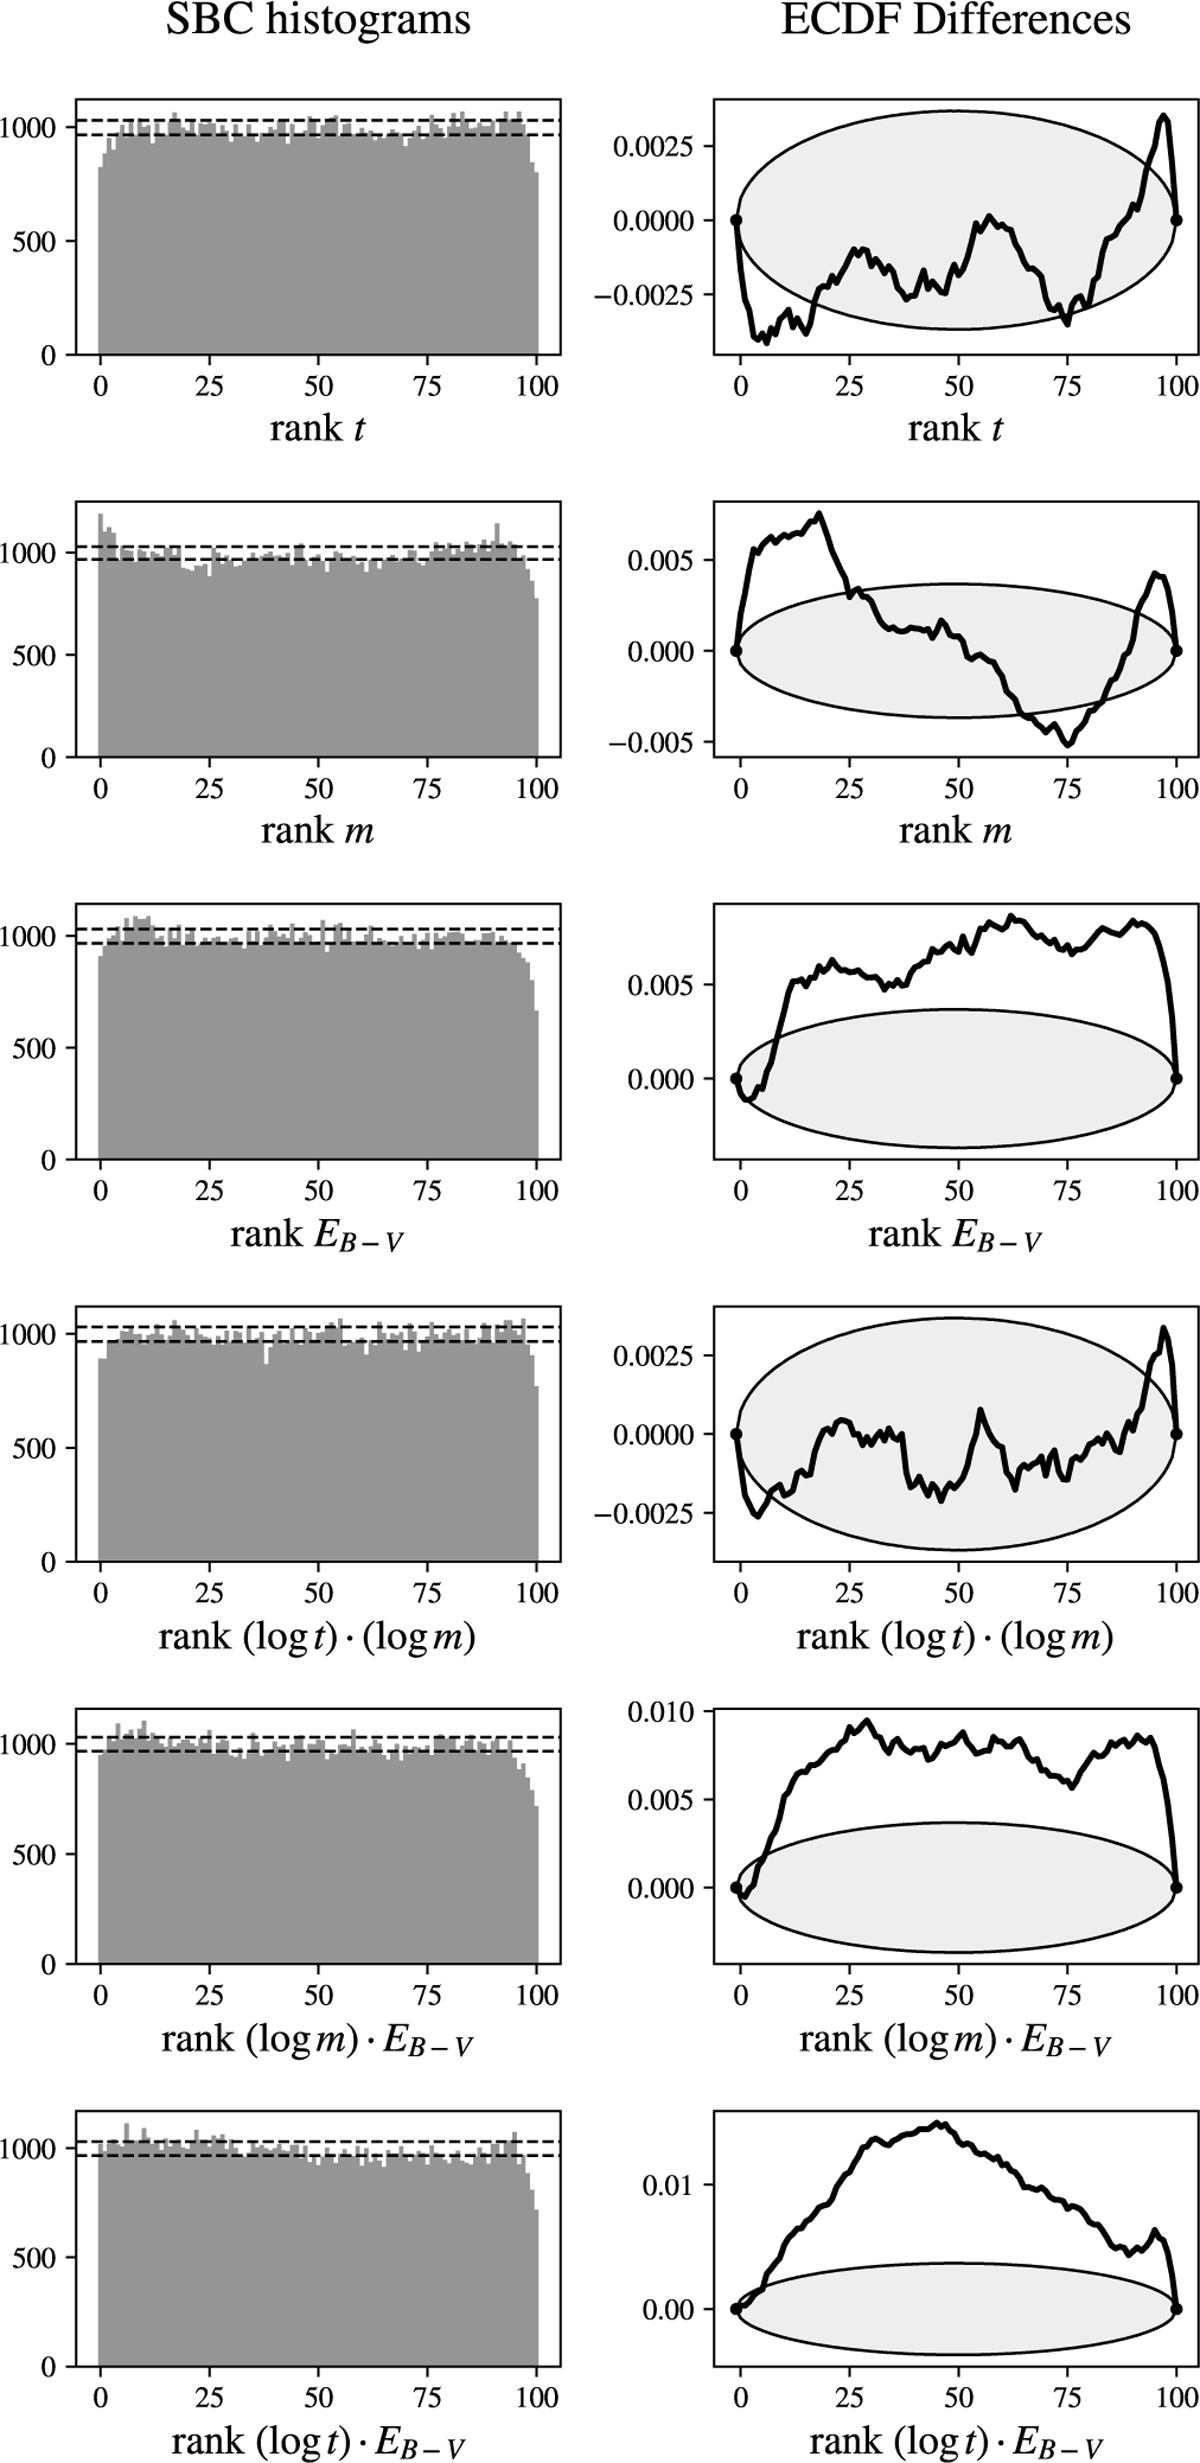
Fig. 3
Download original image
Results of SBC analysis over the entire test set (≈105 parameter–observation pairs). We generated a hundred posterior samples for every element in the test set. Left column: rank histograms for the proposed statistics. Horizontal dashed lines correspond to the ±1σ range under the assumption of uniformity. Right column: difference between rank ECDF and uniform cumulative distribution function. The gray area highlights the expected 0.01–0.99 quantile range of the ECDF difference under the assumption of uniformity.
Current usage metrics show cumulative count of Article Views (full-text article views including HTML views, PDF and ePub downloads, according to the available data) and Abstracts Views on Vision4Press platform.
Data correspond to usage on the plateform after 2015. The current usage metrics is available 48-96 hours after online publication and is updated daily on week days.
Initial download of the metrics may take a while.