Fig. 4
Download original image
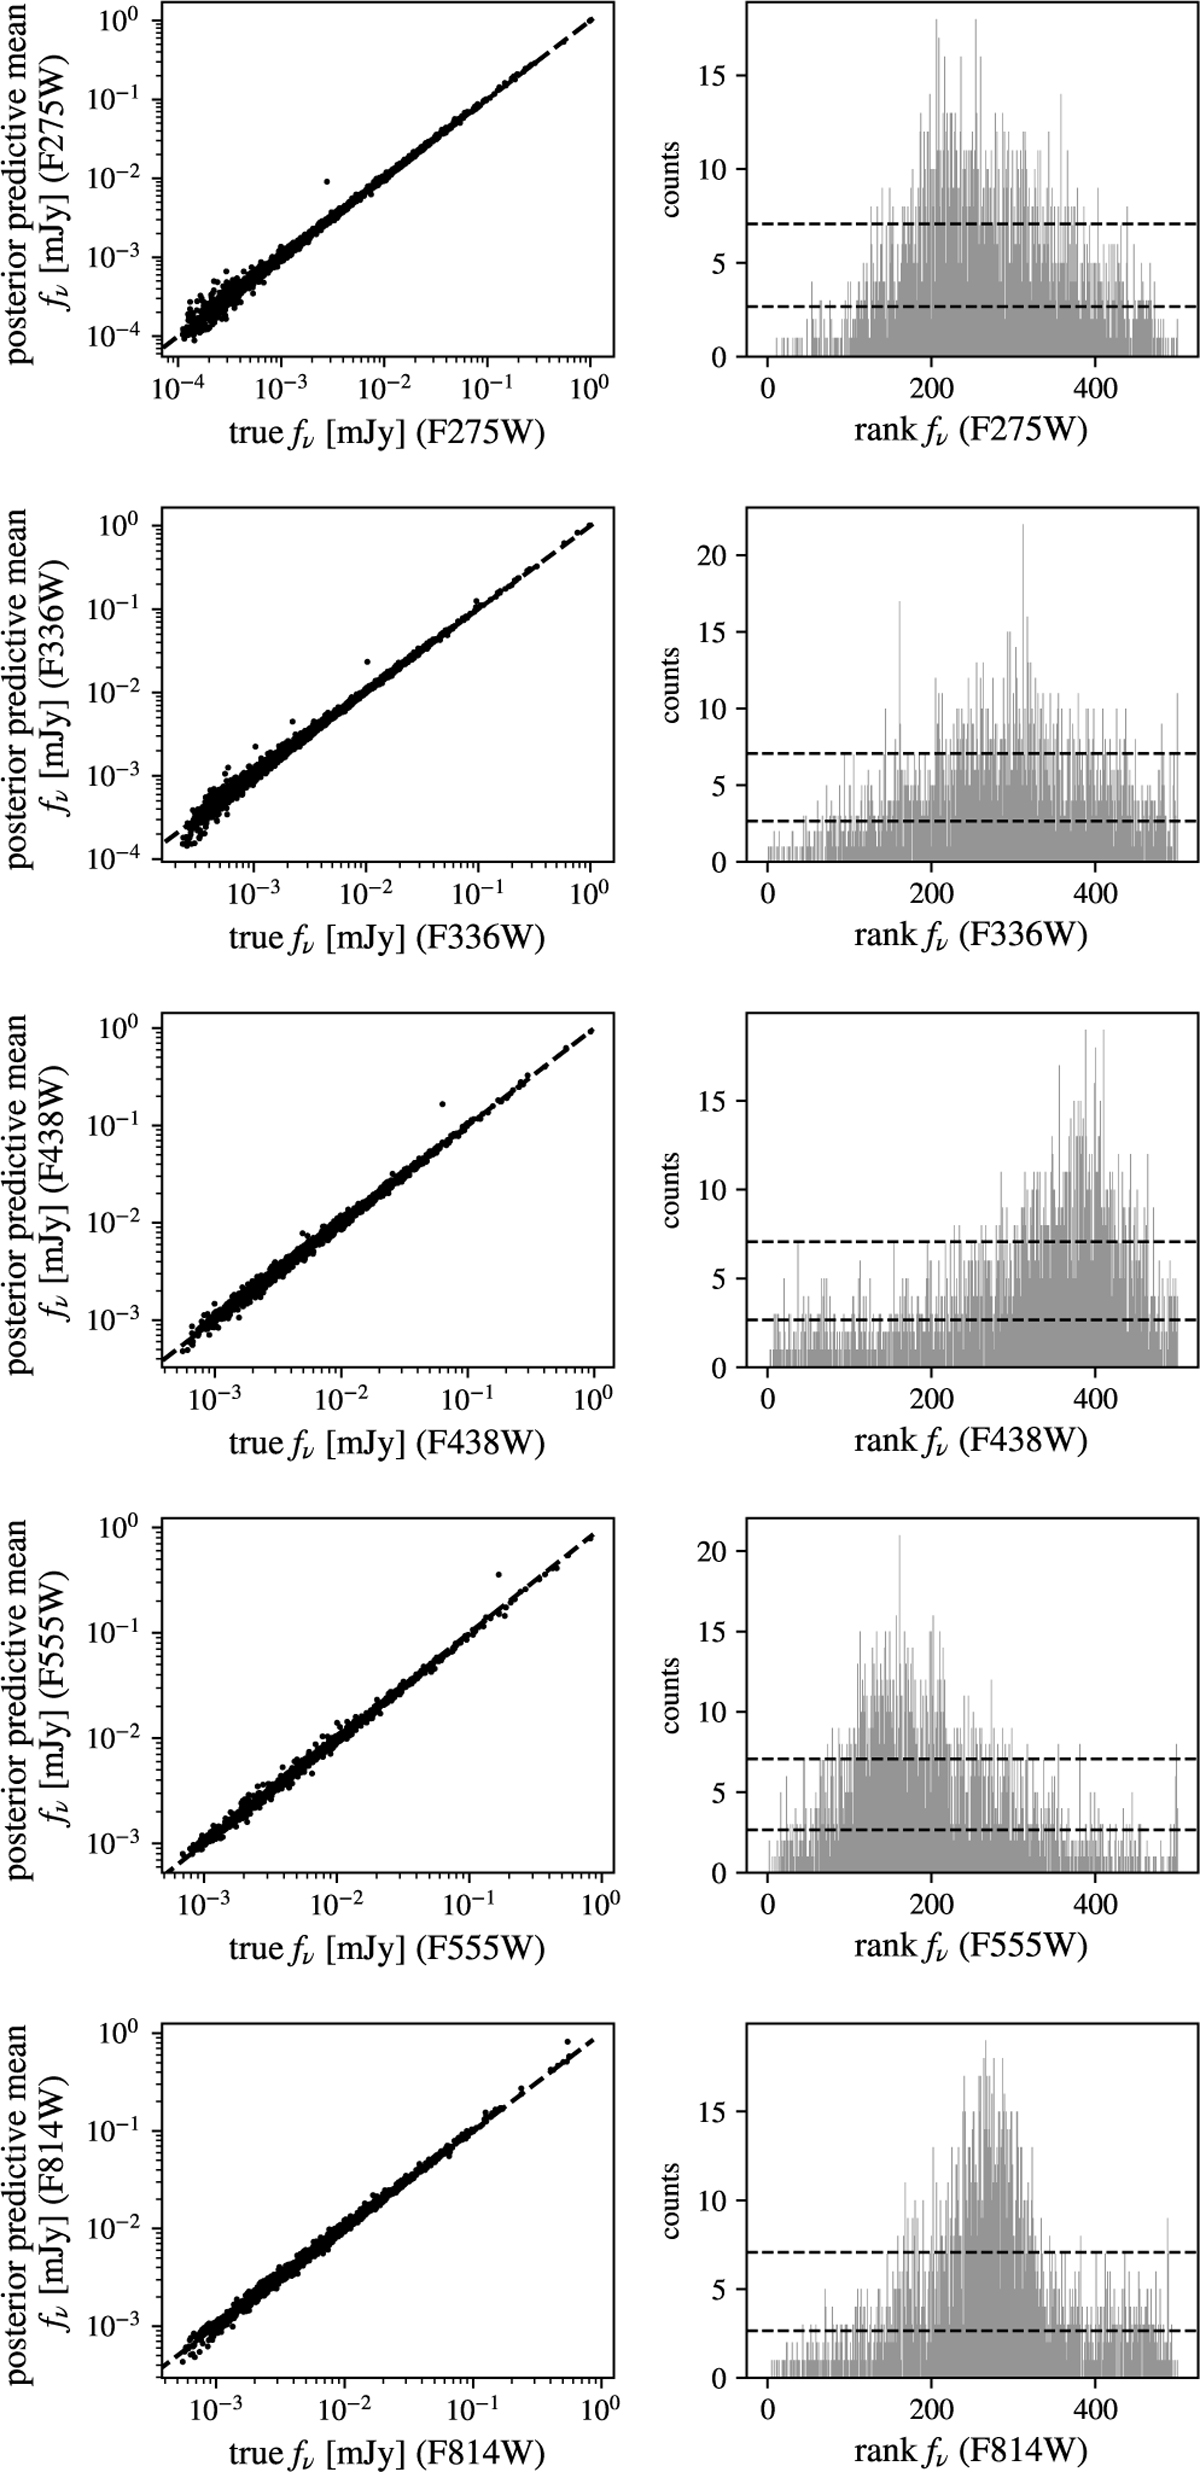
Results of PPC analysis. Posterior predictive distributions with 500 samples each were generated for all clusters in the PHANGS catalog. Left column: comparison of the mean predictive photometry and the initial photometry. Right column: rank distribution of the initial photometry within the posterior predictive distribution. Horizontal dashed lines correspond to the ±1σ range under the assumption of uniformity.
Current usage metrics show cumulative count of Article Views (full-text article views including HTML views, PDF and ePub downloads, according to the available data) and Abstracts Views on Vision4Press platform.
Data correspond to usage on the plateform after 2015. The current usage metrics is available 48-96 hours after online publication and is updated daily on week days.
Initial download of the metrics may take a while.