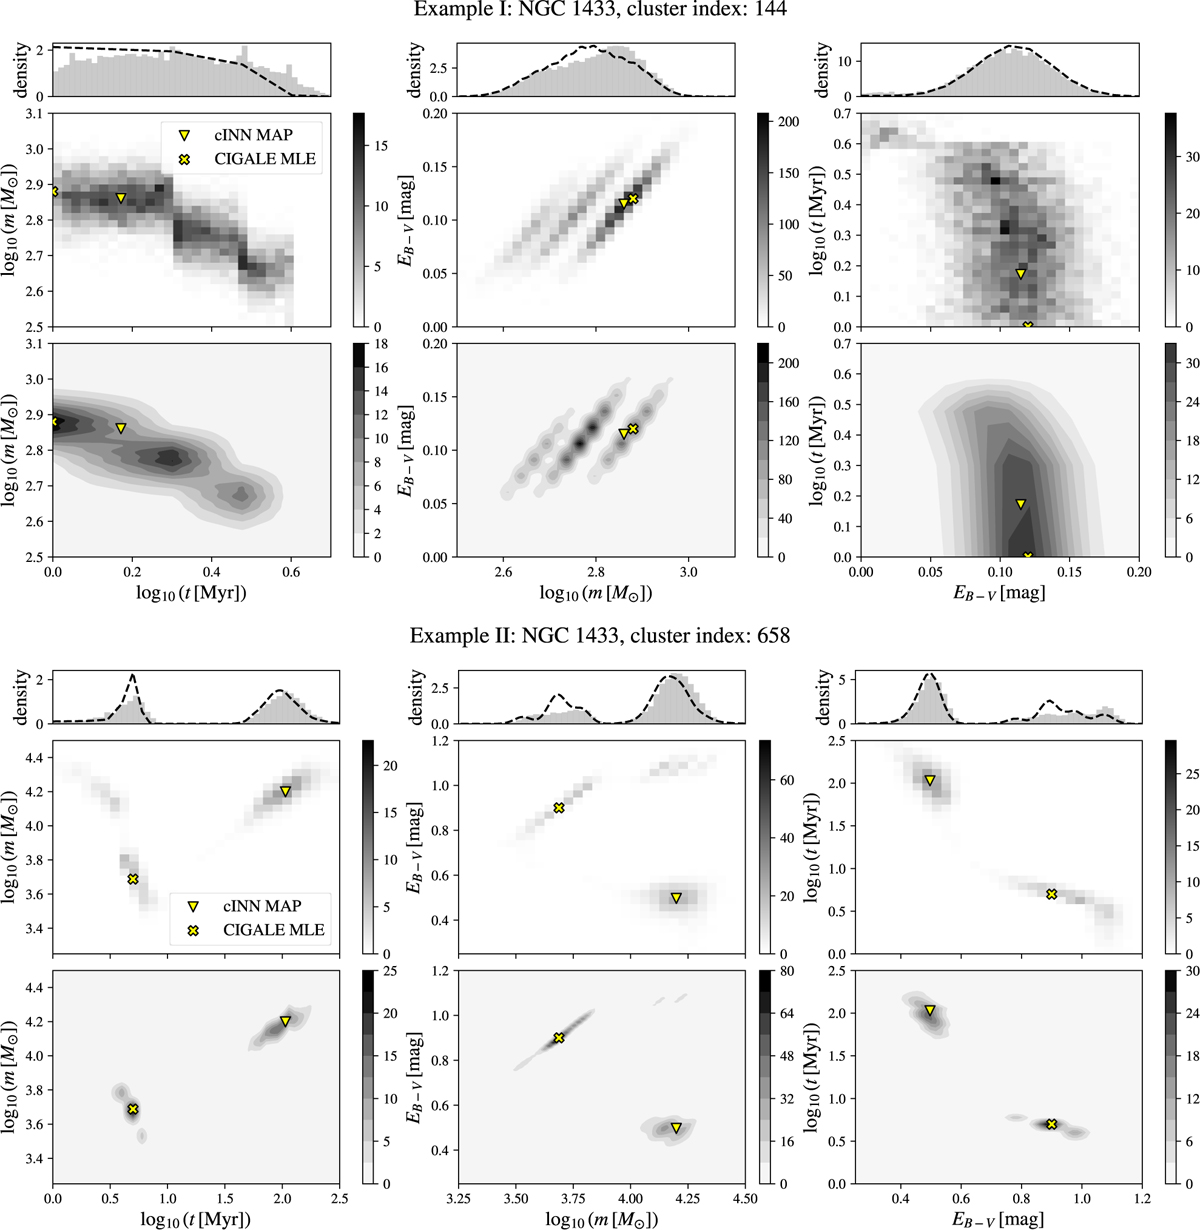
Fig. 5
Download original image
2D and 1D density plots of example posteriors. Top rows: marginal 1D density for the cINN posterior (gray histogram) and ground truth (dashed black line). Middle rows: 2D density of the cINN generated posterior (104 samples per posterior). Bottom rows: contour plot of ground truth densities calculated over a parameter grid. Note that we use the same color maps in the second and third rows (although the colorbars show different ranges). The yellow markers indicate positions of cINN MAP estimates (triangle) and PHANGS MLEs (cross).
Continued.
Current usage metrics show cumulative count of Article Views (full-text article views including HTML views, PDF and ePub downloads, according to the available data) and Abstracts Views on Vision4Press platform.
Data correspond to usage on the plateform after 2015. The current usage metrics is available 48-96 hours after online publication and is updated daily on week days.
Initial download of the metrics may take a while.