Fig. 6
Download original image
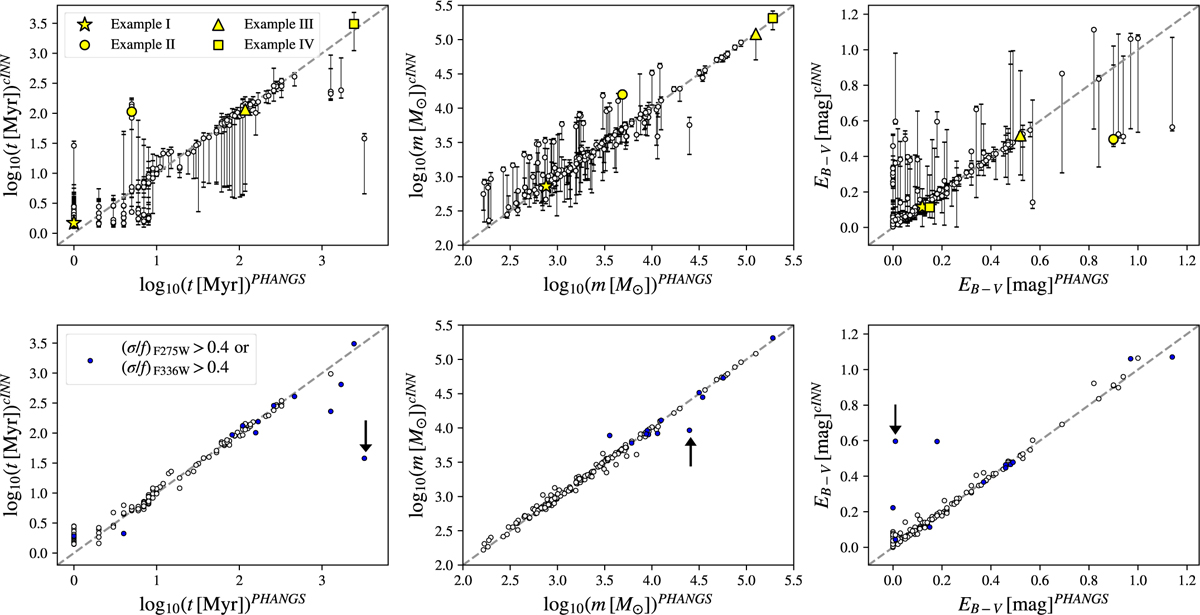
Comparison of cINN posterior modes and PHANGS MLEs for all (filtered) NGC 1433 clusters. Top panels: cINN MAP modes as determined by the mean-shift estimator. Error bars show the 16%- and 84%-quantiles of the marginalized posteriors. The yellow markers indicate the positions of the four example clusters. Bottom panels: comparison with the posterior modes that were closest to the PHANGS MLE (for every posterior, a maximum of three modes were determined). For better visibility, we omitted the error bars. The blue dots mark clusters that have relative flux uncertainties larger than 40% in at least one UV band, as discussed in Sect. 3.2.4. The arrow shows the position of the largest outlier. Comparisons for all galaxies are provided in Appendix B.
Current usage metrics show cumulative count of Article Views (full-text article views including HTML views, PDF and ePub downloads, according to the available data) and Abstracts Views on Vision4Press platform.
Data correspond to usage on the plateform after 2015. The current usage metrics is available 48-96 hours after online publication and is updated daily on week days.
Initial download of the metrics may take a while.