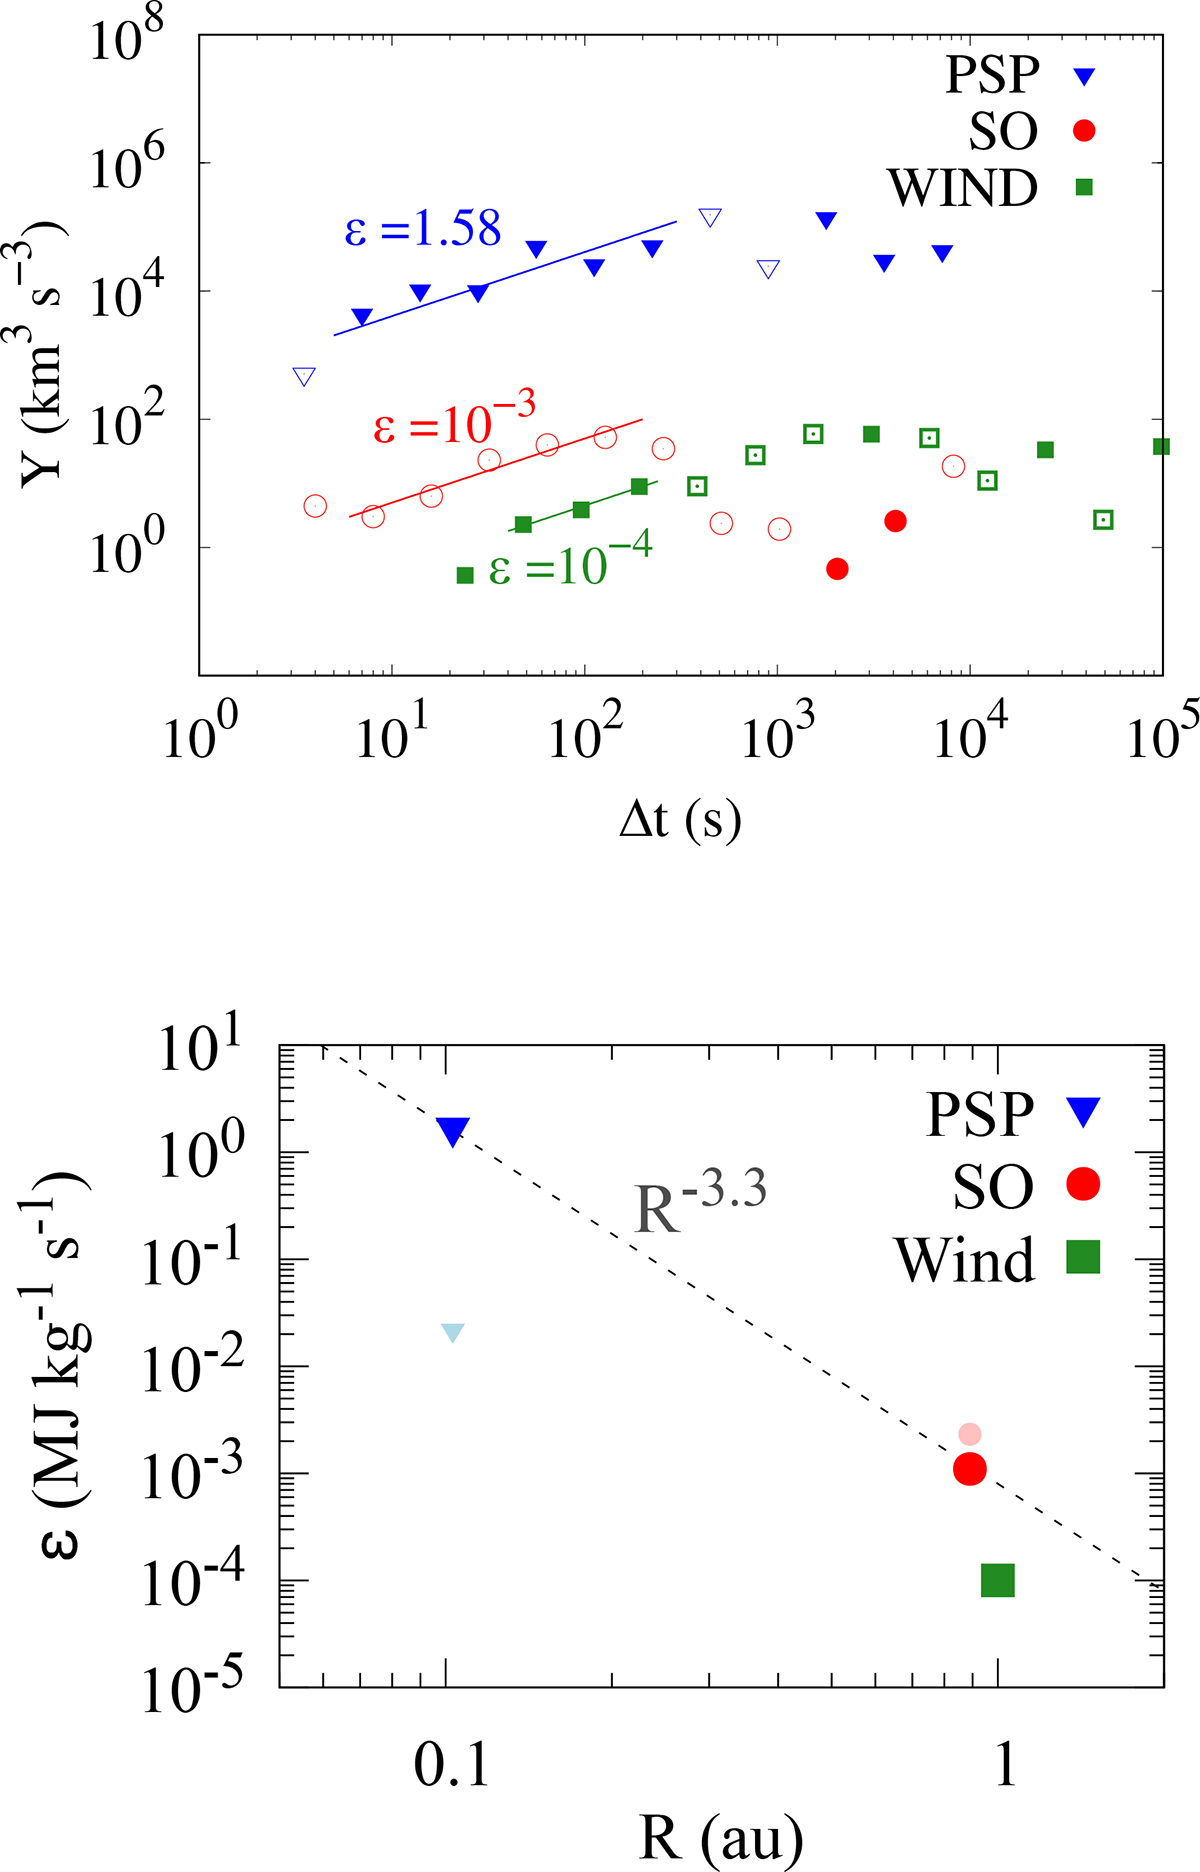
Fig. 12.
Download original image
Top panel: scaling of the mixed third-order moment, Y(Δt), for the intervals measured by PSP (blue triangles), SO (red circles) and Wind (black squares, estimated using a 3-day extended interval). Positive and negative values are indicated with full and open markers, respectively. Linear fits are indicated (gray lines), and the resulting energy transfer rates, ε, are indicated in MJ kg−1 s−1 (color coded). Bottom panel: estimated turbulent energy transfer rate versus radial distance from the Sun, for PSP, SO and extended Wind intervals (same colors as in the top panel). A power-law (dashed line) with decay exponent -3.3 (fitting PSP and SO transfer rates at the first alignment) is shown for reference. The smaller, lighter symbols indicate the estimated turbulent heating rate εT.
Current usage metrics show cumulative count of Article Views (full-text article views including HTML views, PDF and ePub downloads, according to the available data) and Abstracts Views on Vision4Press platform.
Data correspond to usage on the plateform after 2015. The current usage metrics is available 48-96 hours after online publication and is updated daily on week days.
Initial download of the metrics may take a while.