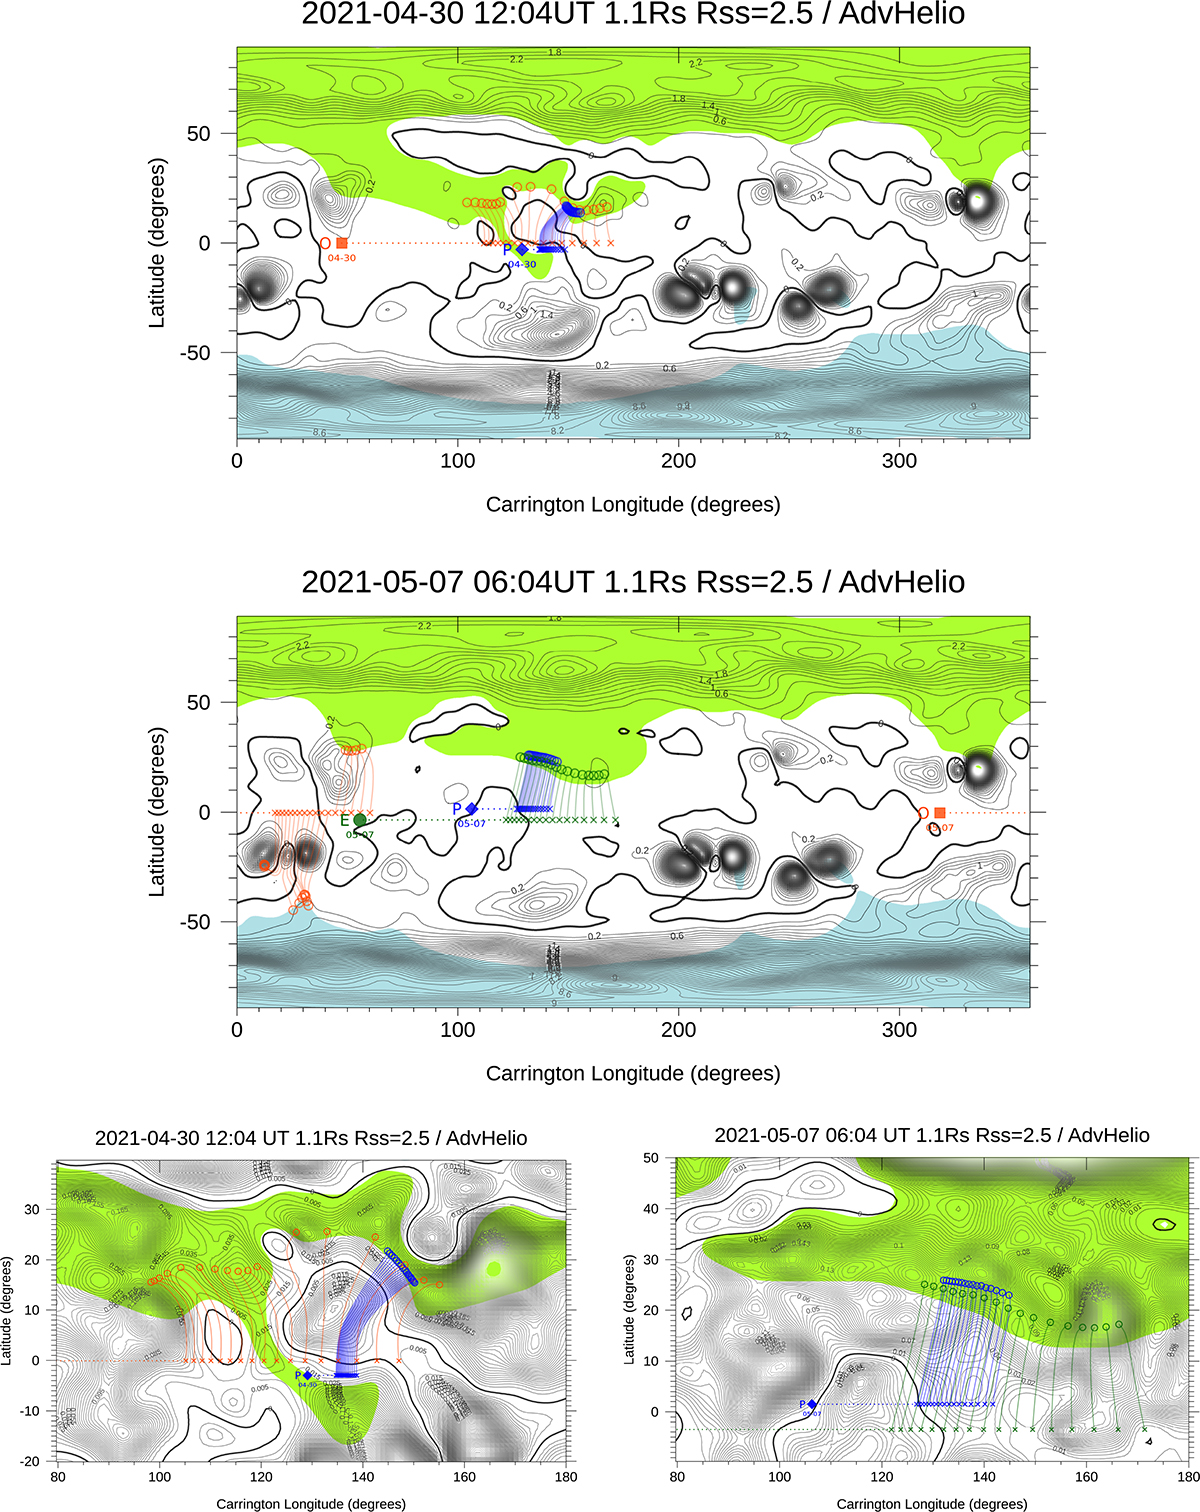
Fig. 2.
Download original image
Potential field source surface B2 contour maps and solar wind magnetic foot-points along Parker Solar Probe (blue), Solar Orbiter (red) and Earth (green) trajectories for April 30, 2021 (upper panel) and May 7, 2021 (middle panel). Open magnetic field regions shown in blue (negative) and green (positive), the neutral line is in black bold. Bottom panels: Zoom of each maps of the upper panels for April 30, 2021 (left panel) and May 7, 2021 (right panel). The solar wind source regions (red, blue and green circles) calculated for the height R = 1.1 R⊙.
Current usage metrics show cumulative count of Article Views (full-text article views including HTML views, PDF and ePub downloads, according to the available data) and Abstracts Views on Vision4Press platform.
Data correspond to usage on the plateform after 2015. The current usage metrics is available 48-96 hours after online publication and is updated daily on week days.
Initial download of the metrics may take a while.