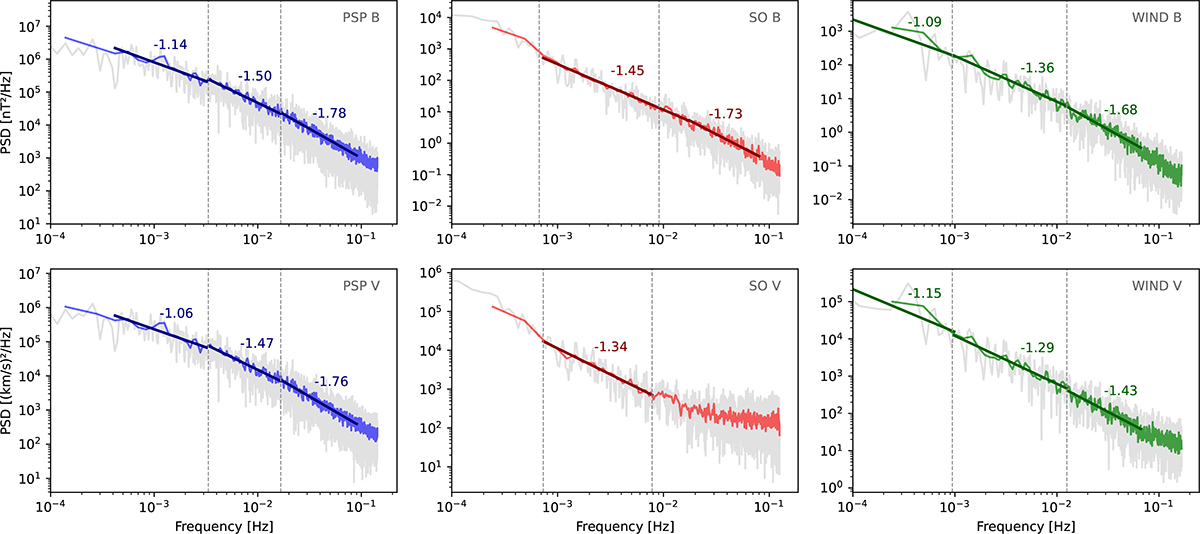
Fig. 8.
Download original image
PSD of the trace of B (top panels) and V (bottom panels). The gray lines indicate the full-frequency PSD, whereas the blue, red and green lines are the corresponding PSDs smoothed through the Welch’s method. Darker blue, red and green solid lines indicate the piecewise fits performed in different frequency intervals as marked by vertical dotted lines. Sectors where power-law fits are missing are strongly affected by instrumental noise.
Current usage metrics show cumulative count of Article Views (full-text article views including HTML views, PDF and ePub downloads, according to the available data) and Abstracts Views on Vision4Press platform.
Data correspond to usage on the plateform after 2015. The current usage metrics is available 48-96 hours after online publication and is updated daily on week days.
Initial download of the metrics may take a while.