Fig. 1
Download original image
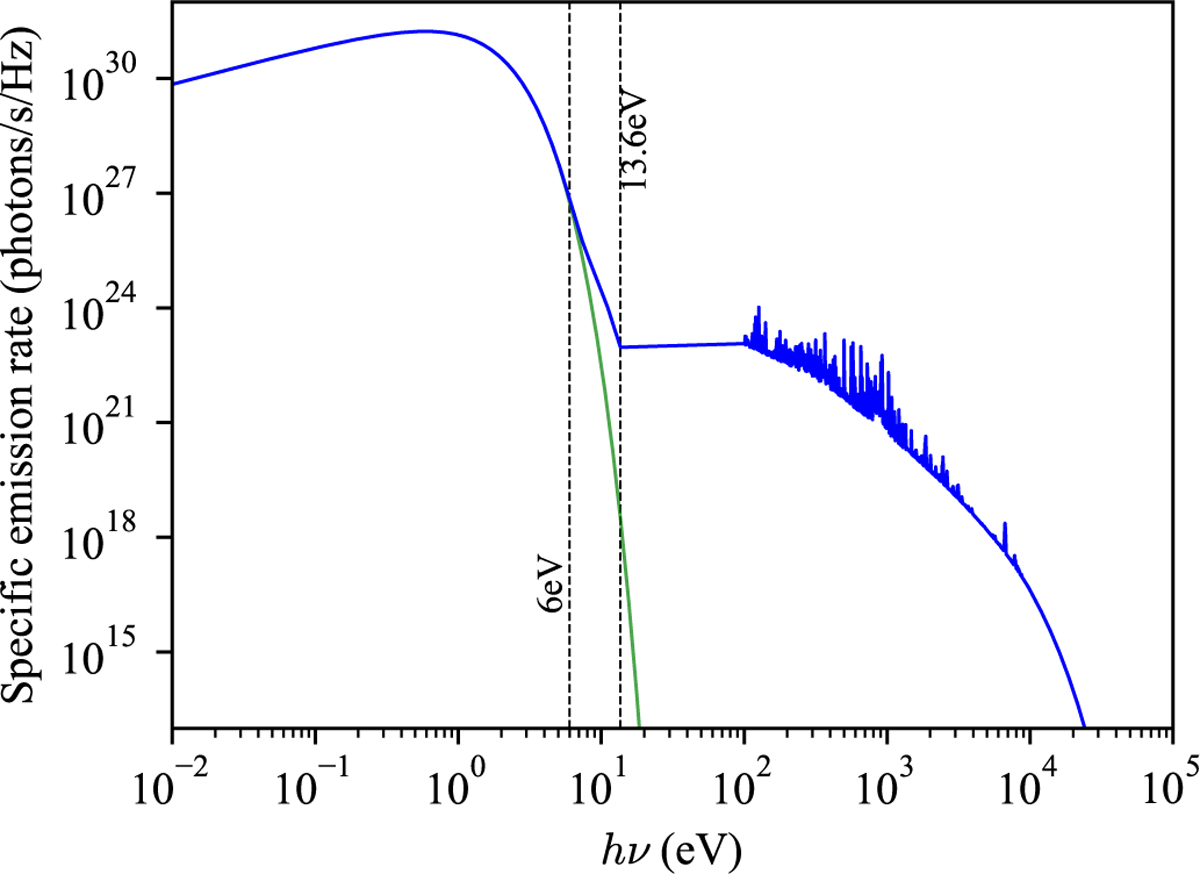
Stellar spectrum adopted in our fiducial model. The vertical dashed lines mark the lower energy limits of the FUV and EUV bands. The lower limit of the X-ray band is 100 eV. (See also Table 1 for the integrated luminosities.) The thin green line shows the photospheric emission, which overlaps with the blue line below 6 eV, for reference.
Current usage metrics show cumulative count of Article Views (full-text article views including HTML views, PDF and ePub downloads, according to the available data) and Abstracts Views on Vision4Press platform.
Data correspond to usage on the plateform after 2015. The current usage metrics is available 48-96 hours after online publication and is updated daily on week days.
Initial download of the metrics may take a while.