Fig. 13
Download original image
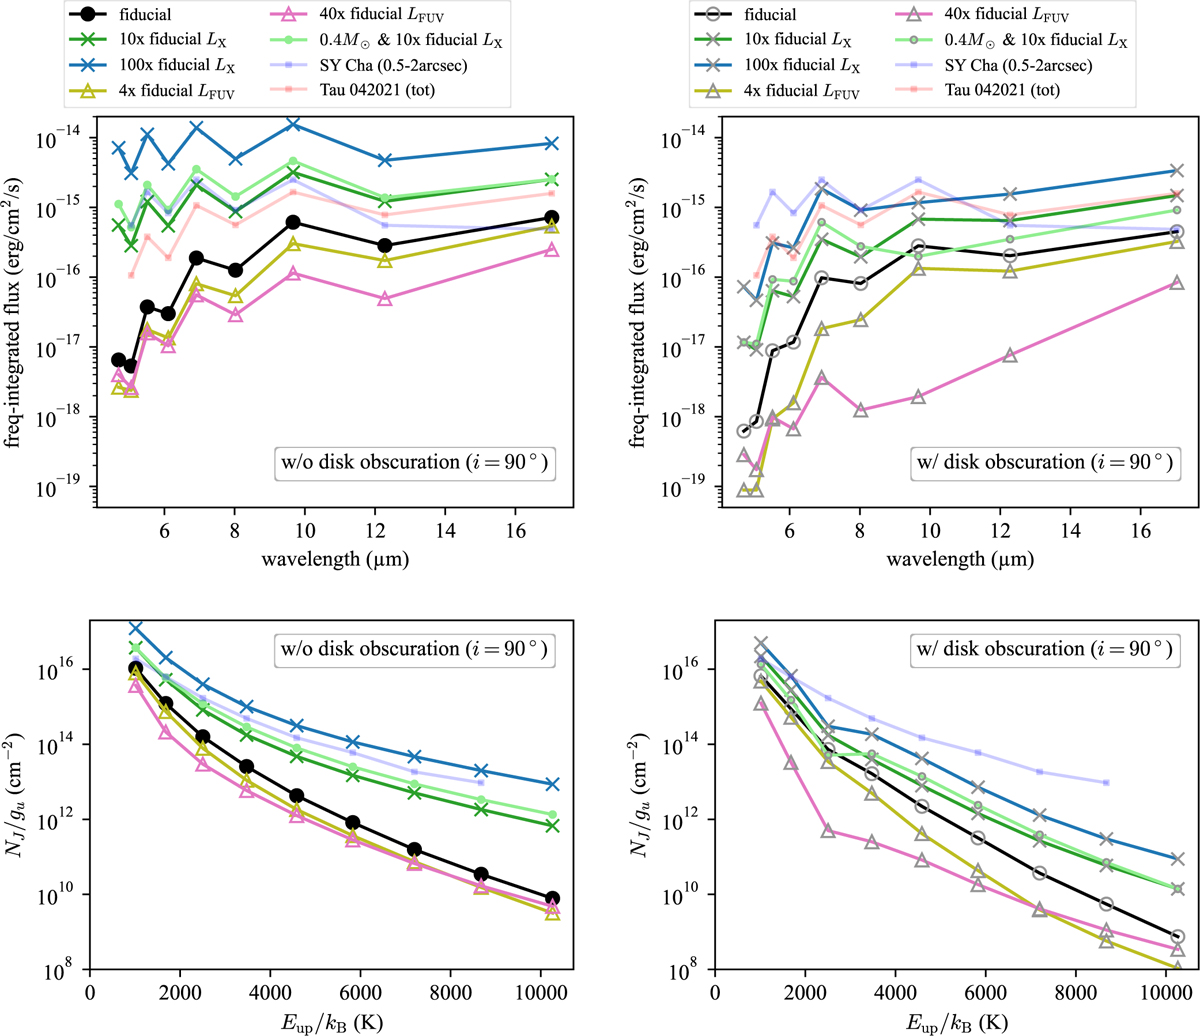
Variations of fluxes and rotation diagrams depending on stellar parameters. Top left: same as Figure 7, but showing line fluxes for models with enhanced FUV and X-ray luminosities: 10 times (green) and 100 times (blue) the fiducial LX, and 4 times (yellow) and 40 times (pink) the fiducial LFUV. The lower-mass run (M* = 0.4 M⊙ with 10 times the fiducial LX) is also included (light green). All fluxes are computed with i = 90° and without disk obscuration. Note that the spatial integration regions and distance differ between our model and the observations (see the caption of Figure 7). Top right: same as the top-left panel, but with reduced fluxes due to disk obscuration. Bottom left: rotation diagram, same as Figure 9, but using the fluxes from the top-left panel. Bottom right: Rotation diagram using the fluxes with disk obscuration from the top-right panel.
Current usage metrics show cumulative count of Article Views (full-text article views including HTML views, PDF and ePub downloads, according to the available data) and Abstracts Views on Vision4Press platform.
Data correspond to usage on the plateform after 2015. The current usage metrics is available 48-96 hours after online publication and is updated daily on week days.
Initial download of the metrics may take a while.