Fig. 14
Download original image
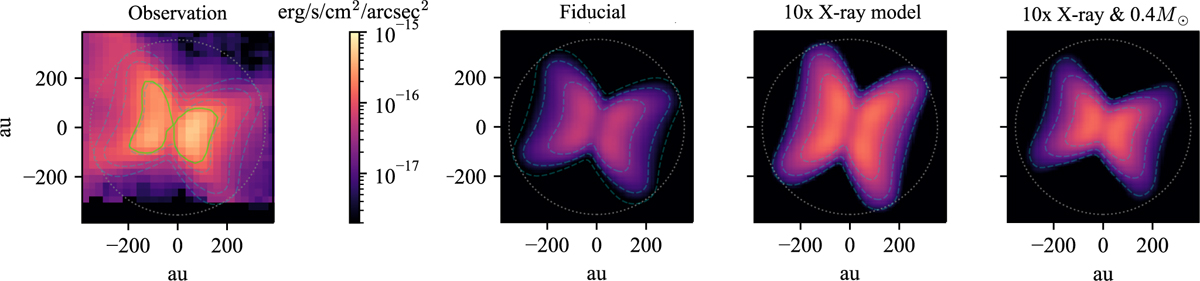
Morphology comparison between the models and observations of Tau 042021 for the S(2) line. Left panel: frequency-integrated continuum-subtracted JWST image from Arulanantham et al. (2024). Three right panels: model S(2) images from the fiducial model (see Figure 10), the ten times X-ray model (LX ≈ 3 × 1031 erg s−1; see Section 4.3), and the test model with M* = 0.4 M⊙ and ten times the X-ray luminosity. All model images are convolved with a 2D Gaussian (FWHM ∼72au) and rotated to match the observed position angle. The circles outlined with gray dots mark the extent of our computational domain. Dashed cyan contours indicate 35%, 10%, and 3% of the peak intensity in each convolved model image; those of the fiducial model are also overplotted on the observed image, which align well with the observed morphology. The green contour in the observed image shows 35% of the peak intensity, approximating the spatial integration domain used to measure the S(2) flux in Arulanantham et al. (2024). Note that the flux integration regions differ between our models and the observations (see Figure 7 and Section 4.4.1 for details). The color scale is shared for all the panels.
Current usage metrics show cumulative count of Article Views (full-text article views including HTML views, PDF and ePub downloads, according to the available data) and Abstracts Views on Vision4Press platform.
Data correspond to usage on the plateform after 2015. The current usage metrics is available 48-96 hours after online publication and is updated daily on week days.
Initial download of the metrics may take a while.