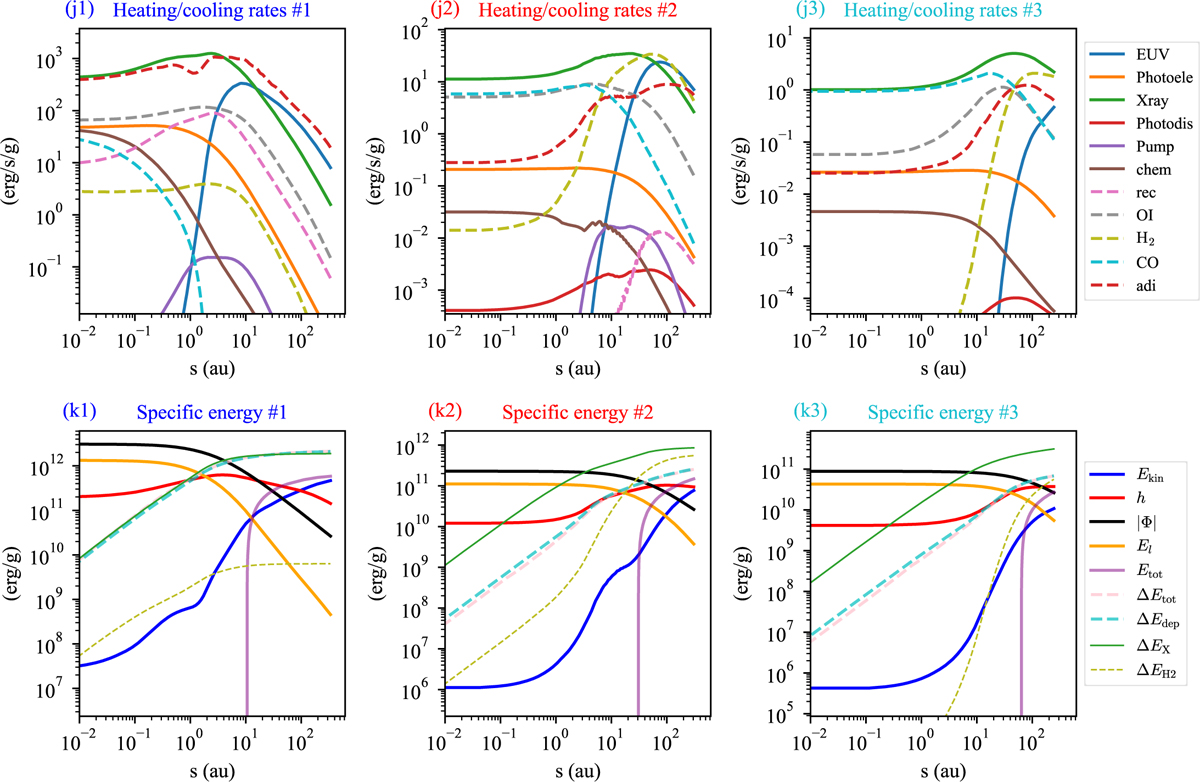
Fig. C.2
Download original image
(top) Specific rates of major heating and cooling processes along the three streamlines in Figure 3, shown from left to right for the blue, red, and cyan streamlines. Labels indicate: EUV photoionization heating (“EUV”); FUV grain photoelectric heating (“Photoele”); X-ray photoionization heating (“X-ray”); H2 photodissociation heating (“Photodis”); H2 pumping followed by collisional deexcitation (“Pump”); chemical heating from dust-catalyzed H2 formation (“chem”); radiative recombination cooling (“rec”); line cooling from OI, H2, and CO; and adiabatic cooling (“adi”). (bottom) Specific energy components along the same streamlines. Blue, red, black, and orange lines show the poloidal kinetic energy, enthalpy, gravitational potential (absolute value), and centrifugal potential, respectively. The purple line indicates total mechanical energy Etot, which varies from negative to positive. Dashed pink line shows the total energy increment, ∆Etot = Etot(s) − Etot(0), which closely overlaps the dashed cyan line showing the total net deposited energy from heating and cooling. Thin green and dashed yellow lines represent energy input from X-ray heating and losses via H2 cooling. On the left panel, the green, cyan, and pink lines nearly coincide.
Current usage metrics show cumulative count of Article Views (full-text article views including HTML views, PDF and ePub downloads, according to the available data) and Abstracts Views on Vision4Press platform.
Data correspond to usage on the plateform after 2015. The current usage metrics is available 48-96 hours after online publication and is updated daily on week days.
Initial download of the metrics may take a while.