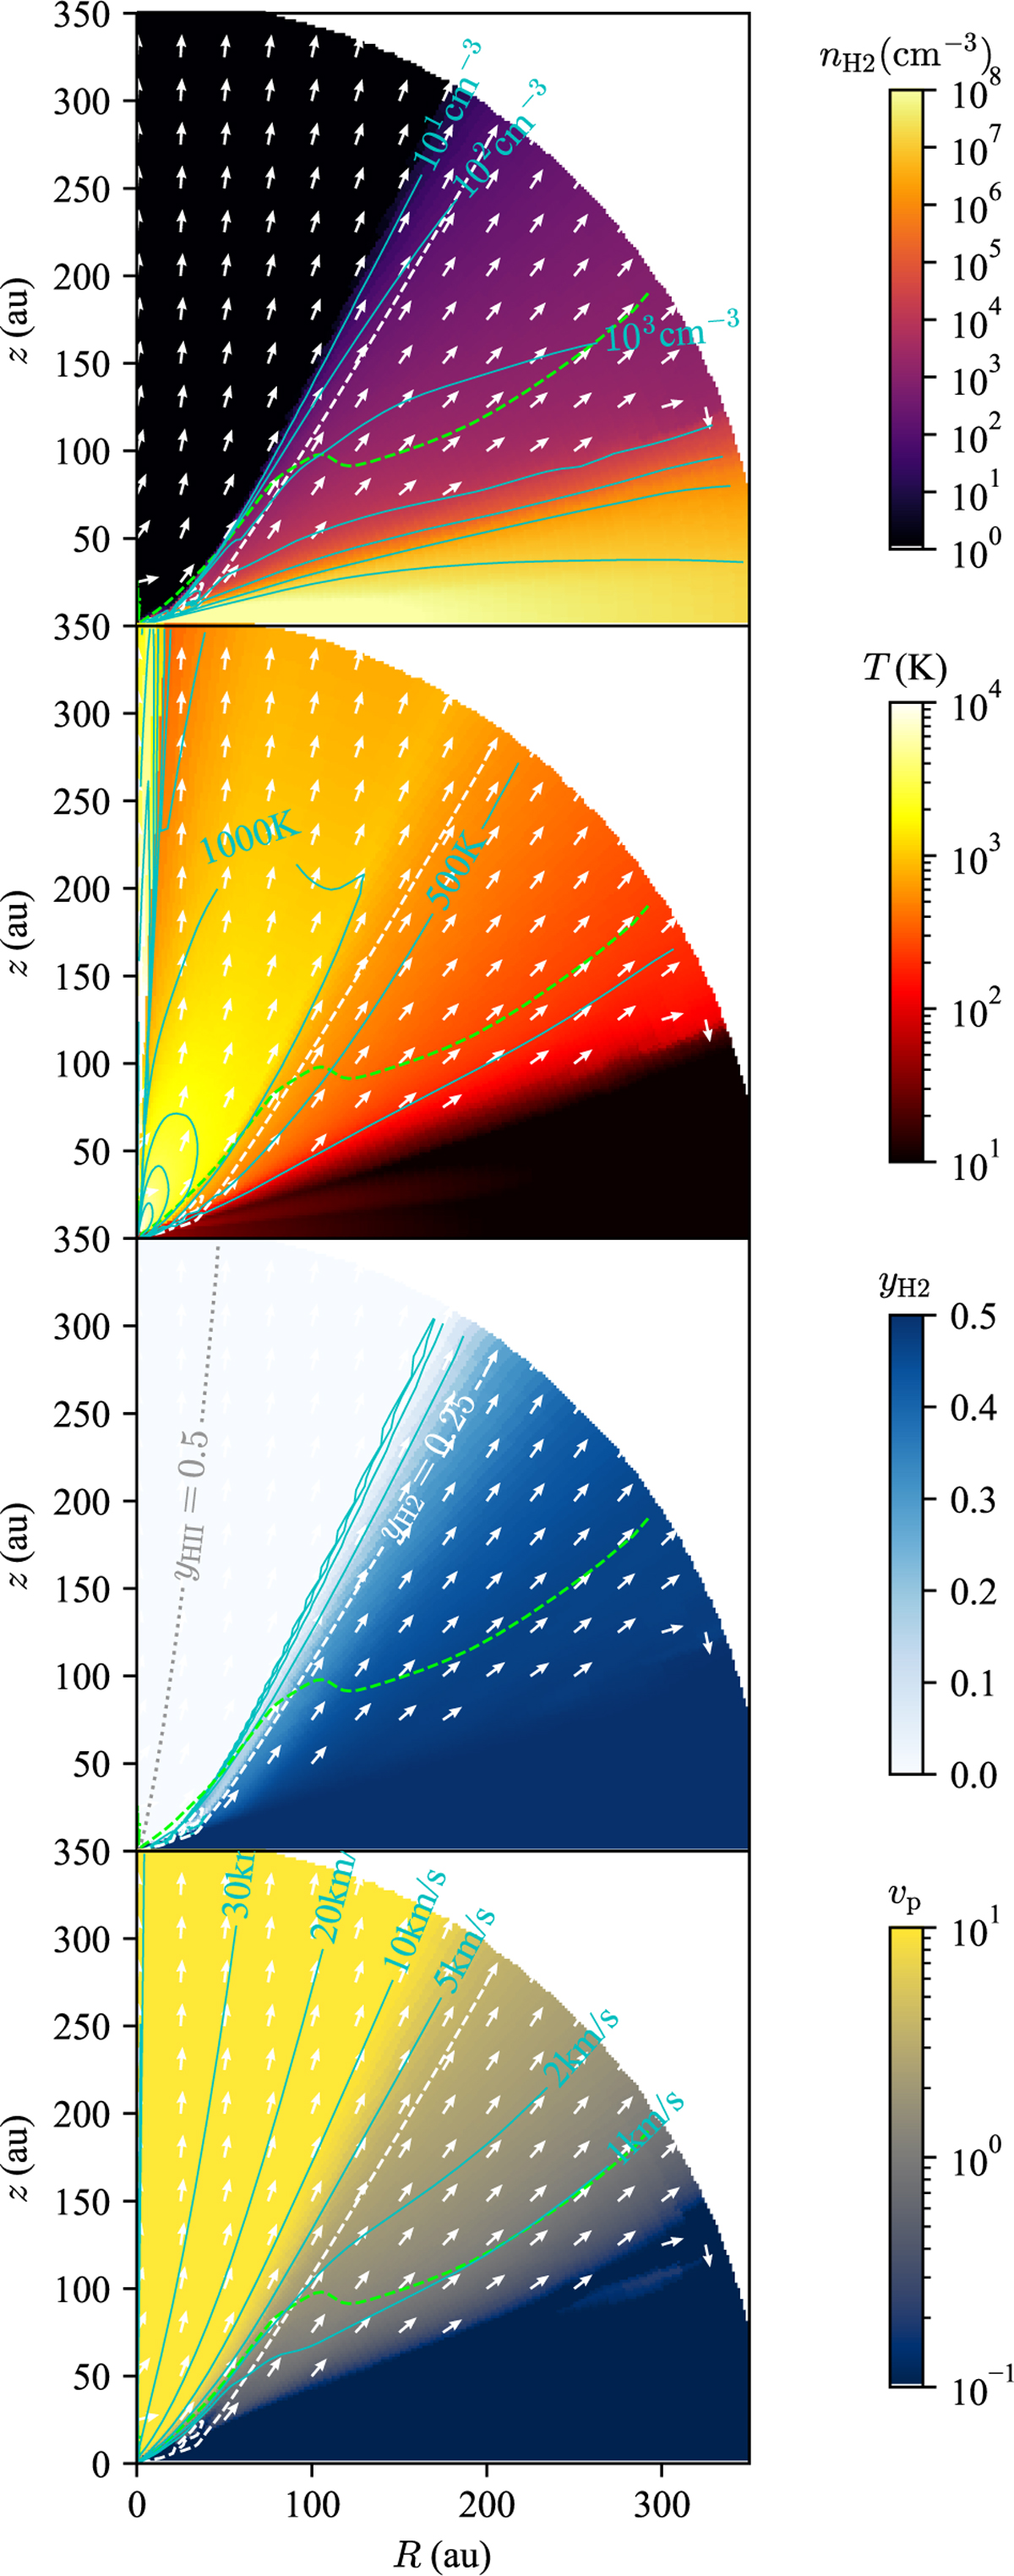
Fig. 2
Download original image
Snapshot of H2 density (top), gas temperature (second), H2 abundance (third), and poloidal velocity (bottom). Cyan contours indicate isosurfaces for each quantity: nH2 = 10, 102, 103, 104, 105, 106, 107cm−3; T = 200, 500, 1000, 2000, 3000, 5000K; yH2 = 10−4,10−3,10−2,10−1; and vp = 1,2,5,10,20,30km s−1. In all panels, the white and green dashed contours denote the H2 dissociation front (yH2 = 0.25) and the isothermal sonic surface, respectively. White arrows indicate the velocity field (direction only, not its magnitude) and are omitted where T < 100K. In the H2 abundance map, the dotted gray contour marks the HI ionization front (yHII = 0.5).
Current usage metrics show cumulative count of Article Views (full-text article views including HTML views, PDF and ePub downloads, according to the available data) and Abstracts Views on Vision4Press platform.
Data correspond to usage on the plateform after 2015. The current usage metrics is available 48-96 hours after online publication and is updated daily on week days.
Initial download of the metrics may take a while.