Fig. 3
Download original image
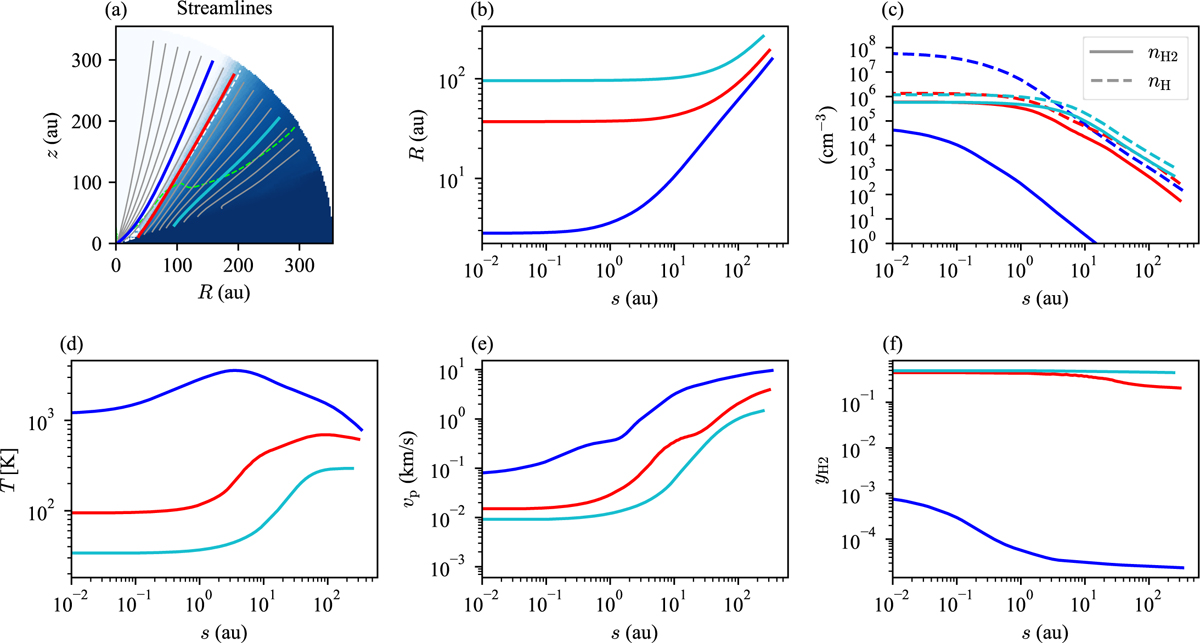
Physical properties along streamlines. (a) H2 abundance map (same as Figure 2) with selected streamlines shown in gray. Three representative streamlines are marked in blue, red, and cyan. (b-f) Profiles of cylindrical radius, densities, temperature, poloidal velocity, and H2 abundance along the three streamlines, using consistent color coding. The horizontal axis indicates the distance along each streamline, with s = 0 defined at the base. In panel c, solid and dashed lines show H2 and hydrogen nucleus densities, respectively.
Current usage metrics show cumulative count of Article Views (full-text article views including HTML views, PDF and ePub downloads, according to the available data) and Abstracts Views on Vision4Press platform.
Data correspond to usage on the plateform after 2015. The current usage metrics is available 48-96 hours after online publication and is updated daily on week days.
Initial download of the metrics may take a while.