Fig. 4
Download original image
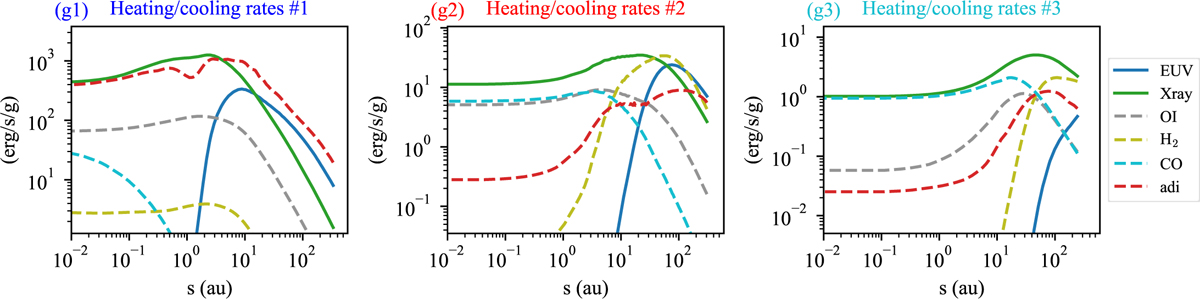
Specific rates of major heating and cooling processes along the blue, red, and cyan streamlines in Figure 3, shown from left to right. Labels indicate: EUV photoionization heating (“EUV”); X-ray photoionization heating (“X-ray”); line cooling from O I, H2, and CO; and adiabatic cooling (“adi”). (See Figure C.2 in Appendix for the heating and cooling rates of other processes.)
Current usage metrics show cumulative count of Article Views (full-text article views including HTML views, PDF and ePub downloads, according to the available data) and Abstracts Views on Vision4Press platform.
Data correspond to usage on the plateform after 2015. The current usage metrics is available 48-96 hours after online publication and is updated daily on week days.
Initial download of the metrics may take a while.