Fig. 7
Download original image
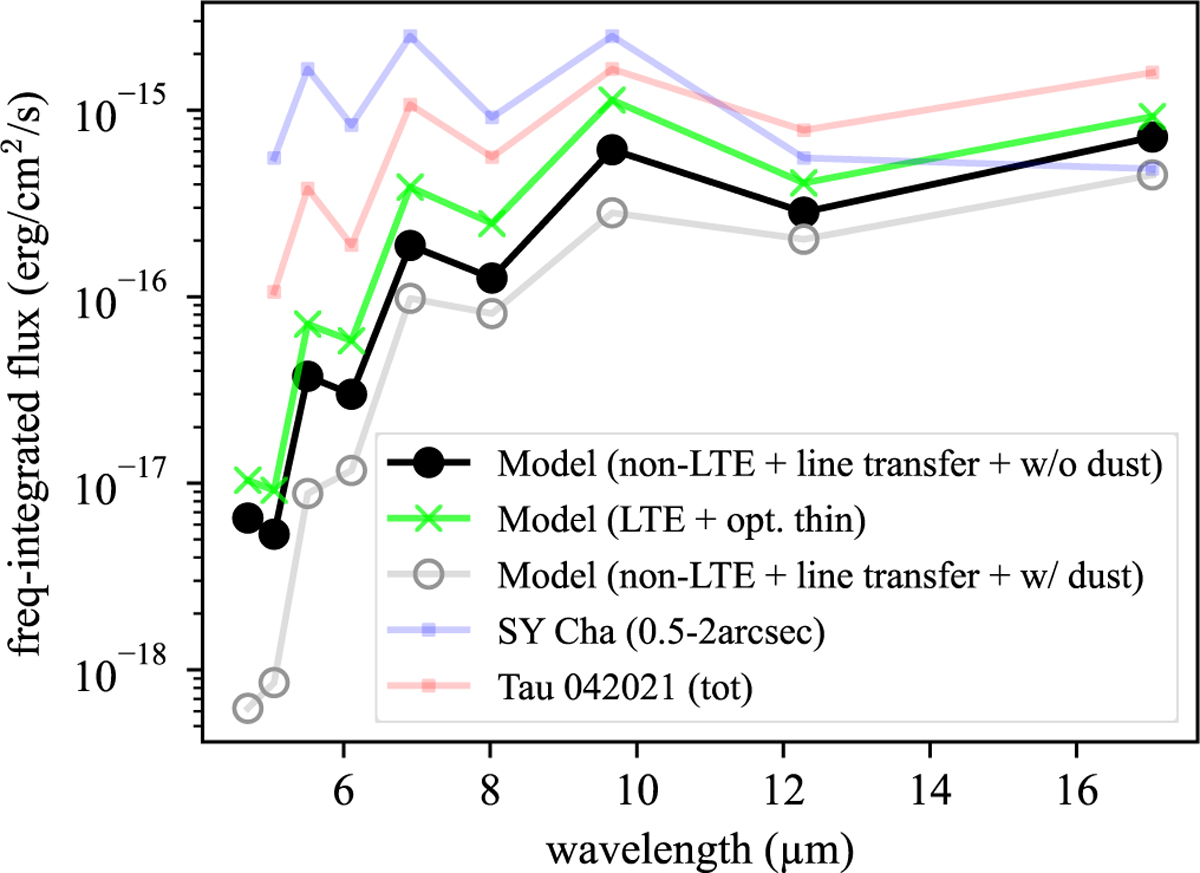
Integrated fluxes of the S(1)-S(9) lines for the model with i = 90° without disk obscuration and assuming d = 140 pc (black dots). For reference, green crosses indicate the fluxes calculated under the assumptions of LTE and optically thin emission. Observed fluxes for SY Cha (blue; d = 180.7 pc) and Tau 042021 (red; d ~ 140 pc) are also shown for comparison. For SY Cha, we adopted the fluxes measured with a radius aperture of 0.5-2″. Since the spatial integration regions differ between our model and the observations of Tau 042021, and the SY Cha fluxes are not scaled by distance, care should be taken when making direct comparisons (see also Sections 4.4.1 and 4.4.2 and Figure 14). Open circles correspond to the model fluxes with i = 90° but including disk obscuration (Section 3.7; Table 5).
Current usage metrics show cumulative count of Article Views (full-text article views including HTML views, PDF and ePub downloads, according to the available data) and Abstracts Views on Vision4Press platform.
Data correspond to usage on the plateform after 2015. The current usage metrics is available 48-96 hours after online publication and is updated daily on week days.
Initial download of the metrics may take a while.