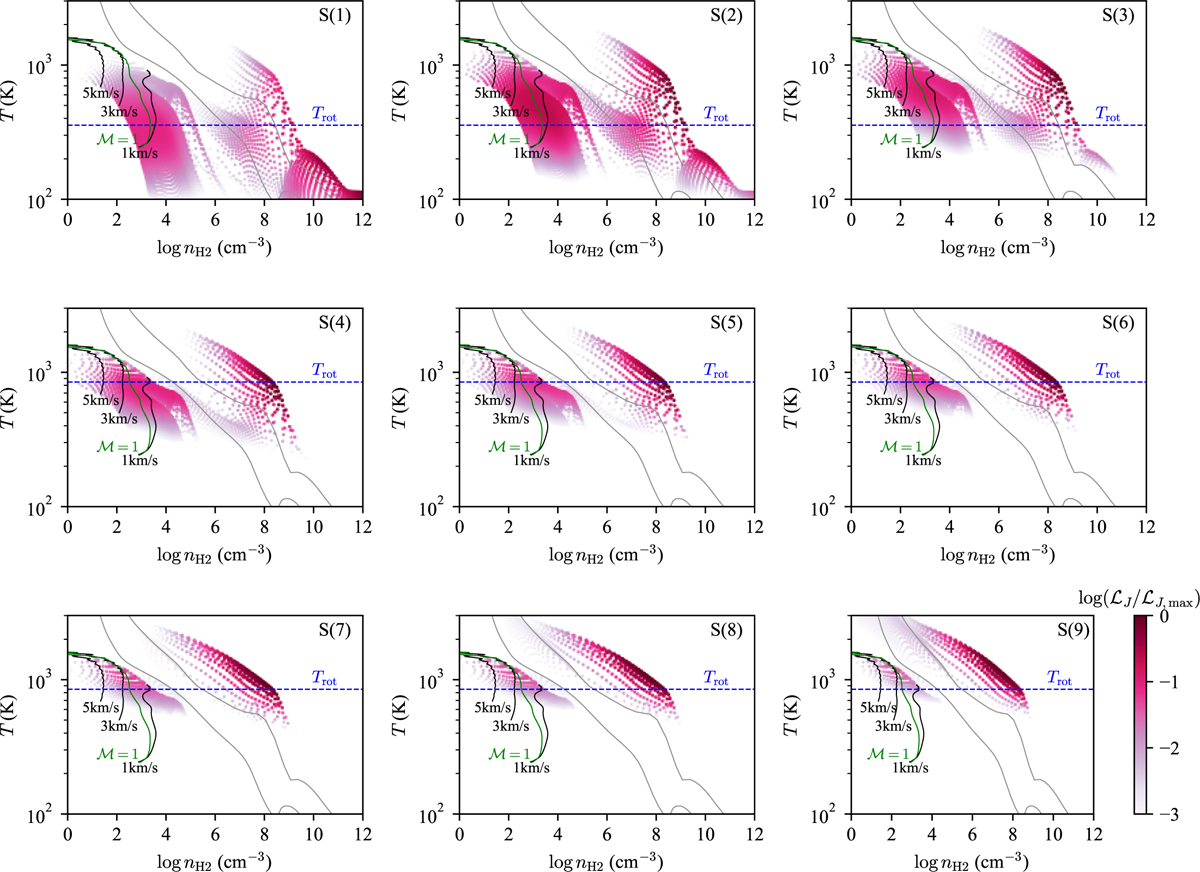
Fig. 8
Download original image
Phase-space scatter plots of the normalized local integrated luminosity LJ/LJ,max for each H2 line. Each point corresponds to a computational cell in the simulation, with point size scaled by LJ/LJ,max to reduce overlap and emphasize more emissive regions. The reddish areas highlight the densities and temperatures ranges that most strongly contribute to the total emission. Solid black lines mark approximate contours of poloidal wind velocity (vp = 1, 3, and 5 km s−1), and the green contour indicates the isothermal sonic surface. Dashed blue lines represent the best-fit rotational temperatures (Table 4).
Current usage metrics show cumulative count of Article Views (full-text article views including HTML views, PDF and ePub downloads, according to the available data) and Abstracts Views on Vision4Press platform.
Data correspond to usage on the plateform after 2015. The current usage metrics is available 48-96 hours after online publication and is updated daily on week days.
Initial download of the metrics may take a while.