Fig. 9
Download original image
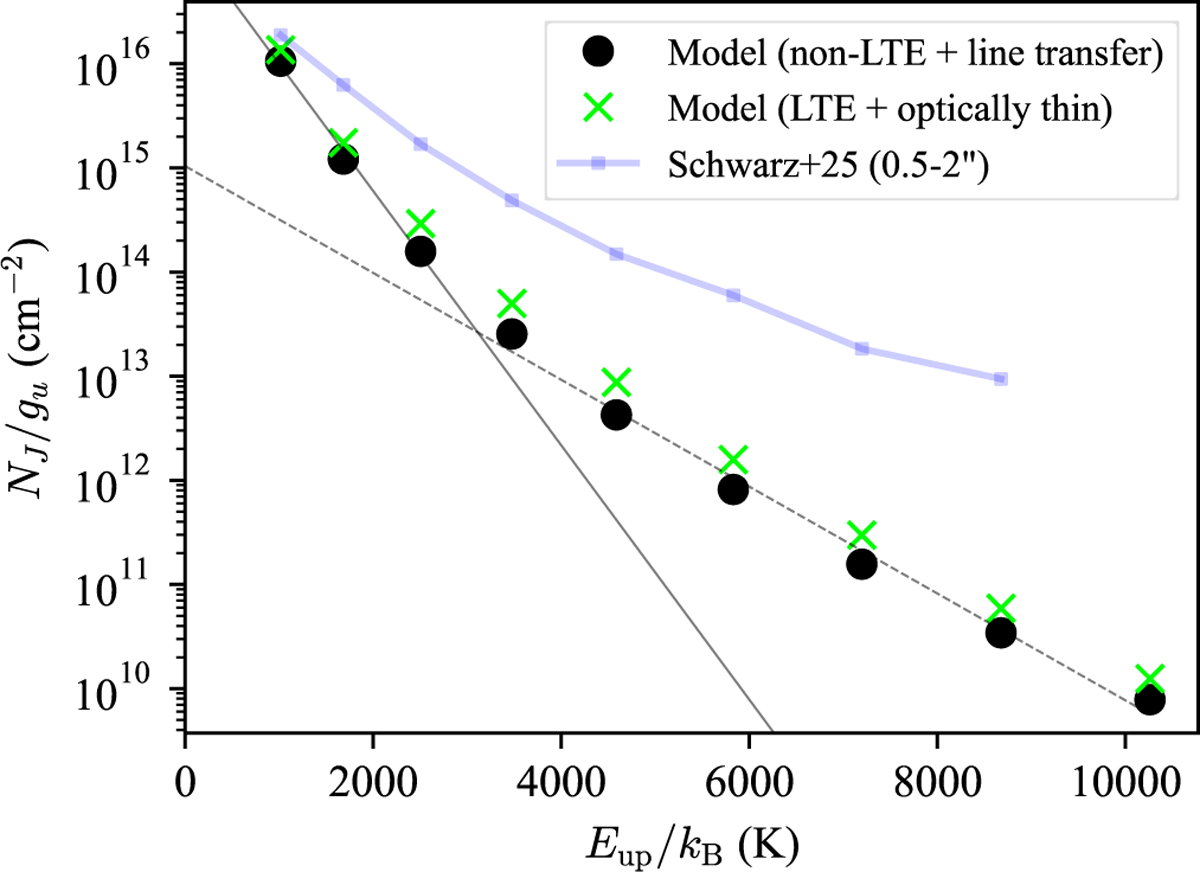
Rotation diagram of the H2 lines. Black dots show the model results from non-LTE calculations with line transfer using RADMC-3D. The solid and dashed black lines are a two-component fit to the lower J lines S(1)-S(3) and the higher J lines S(4)-S(9), respectively. Green crosses indicate the values assuming LTE and optically thin emission -i.e., the maximum emission possible within our model setup. For reference, observational data for SY Cha are shown with a blue line (Schwarz et al. 2025a). Since the emitting area is not specified in Arulanantham et al. (2024), the data for Tau 042021 are omitted to avoid introducing additional uncertainties.
Current usage metrics show cumulative count of Article Views (full-text article views including HTML views, PDF and ePub downloads, according to the available data) and Abstracts Views on Vision4Press platform.
Data correspond to usage on the plateform after 2015. The current usage metrics is available 48-96 hours after online publication and is updated daily on week days.
Initial download of the metrics may take a while.