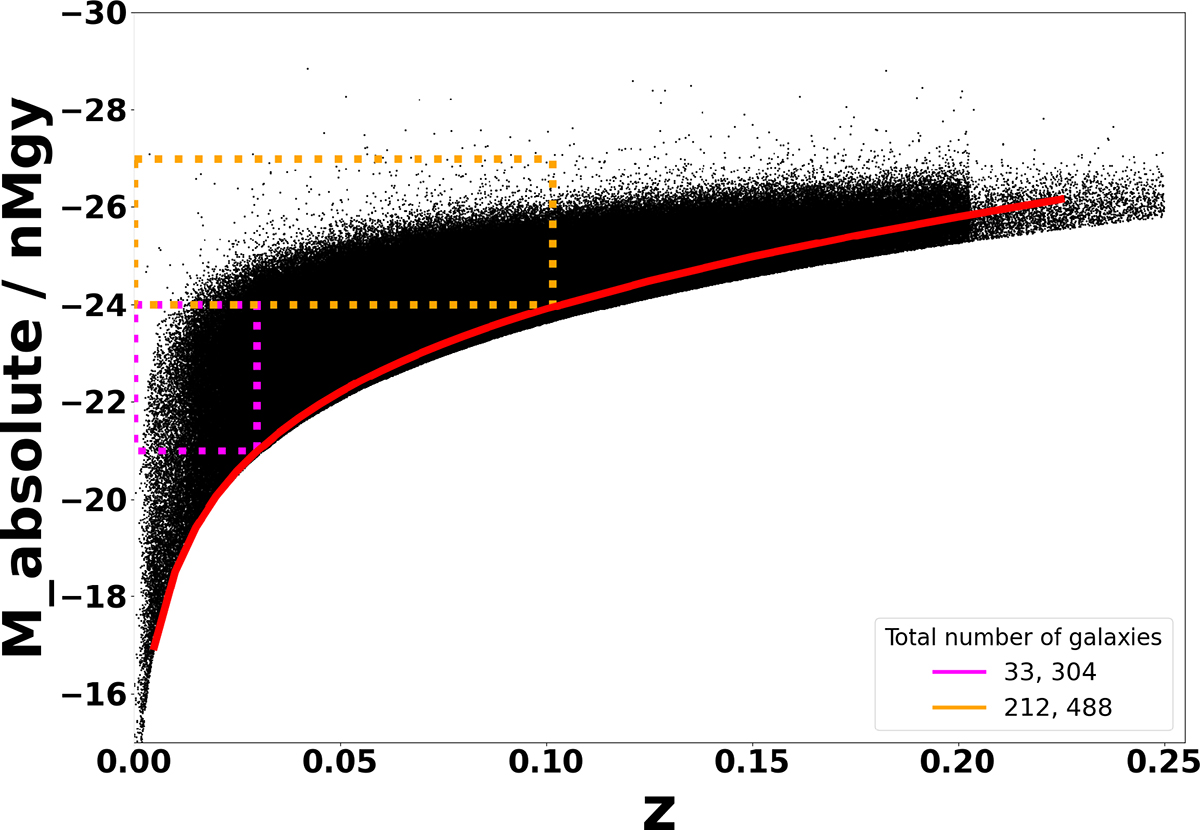
Fig. 4.
Download original image
MW1 versus spectroscopic redshift for galaxies in our sample. The red line represents the predicted evolution for a slowly evolving galaxy with W1 = 14.7 at z = 0. The violet and orange boxes define the two volume-limited samples we search for pairs in. We refer to the violet box (−21 < MW1 < −24 and z < 0.03) as Box 1 and to the orange box (−24 < MW1 < −27 and z < 0.10) as Box 2.
Current usage metrics show cumulative count of Article Views (full-text article views including HTML views, PDF and ePub downloads, according to the available data) and Abstracts Views on Vision4Press platform.
Data correspond to usage on the plateform after 2015. The current usage metrics is available 48-96 hours after online publication and is updated daily on week days.
Initial download of the metrics may take a while.