| Issue |
A&A
Volume 706, February 2026
|
|
|---|---|---|
| Article Number | A264 | |
| Number of page(s) | 13 | |
| Section | Extragalactic astronomy | |
| DOI | https://doi.org/10.1051/0004-6361/202556745 | |
| Published online | 13 February 2026 | |
Dynamically close galaxy pairs from the unWISE survey
Testing the merger-AGN-star formation connection
1
Department of Physics, School of Mathematics and Natural Sciences, Copperbelt University P.O. Box 21692 Kitwe, Zambia
2
Department of Physics and Astronomy, Botswana International University of Science and Technology Private Bag 16 Palapye, Botswana
3
Finnish Centre for Astronomy with ESO, University of Turku Vesilinnantie 5 Turku 20014, Finland
4
Instituto de Astrofísica de Andalucía (IAA), Spanish National Research Council (CSIC) 18008 Granada, Spain
5
Department of Astronomy and Astrophysics, Space Science and Geospatial Institute (SSGI) P.O. Box 33679 Addis Ababa, Ethiopia
6
Department of Physics, Faculty of Science, Mbarara University of Science and Technology (MUST) P.O. Box 1410 Mbarara, Uganda
★ Corresponding author: This email address is being protected from spambots. You need JavaScript enabled to view it.
Received:
4
August
2025
Accepted:
17
December
2025
Abstract
Context. Galaxy mergers are expected to have a profound influence on the star formation histories of galaxies. It is generally expected that mergers are the main drivers of galaxy mass growth through the accretion of mass and the triggering of new star formation episodes, while the shocks and torques induced by the merger may drive gas and dust to central supermassive black holes and fuel active galactic nucleus (AGN) activity and produce both positive and negative feedback.
Aims. We test whether a merger-AGN-star formation connection exists by selecting samples of galaxy pairs of stellar masses log(M/M⊙)∼10.2 and ∼11.4 within redshift z < 0.25 at various projected separation and velocity differences in an increasing order, and would therefore have a decreasing probability of being truly bound and interacting.
Methods. We identified galaxies in close pairs and then measured their star formation rates (SFRs; via their NUV − r colours) and the degree of AGN activity (from X-rays, radio emission at 20 cm, WISE infrared colours, and emission line ratios) as a function of their projected separation and velocity difference.
Results. We find only weak evidence that galaxies in pairs have higher SFRs as galaxies become closer in projected and velocity separation. This trend occurs for pairs at closest separation of rp < 20 kpc and ΔV < 500 km/s. Similarly, we observe no strong evidence that AGNs are more common for galaxies in closer pairs, irrespective of the method used to detect AGNs.
Conclusions. For this sample, we did not find any clear evidence that mergers and interactions may play a significant role in triggering star formation and AGN activity, opposite to expectations from theoretical models invoking feedback episodes. Secular processes may be more important, although this may depend on the selection of galaxies and indicators for star formation and AGN activity.
Key words: galaxies: active / galaxies: interactions / galaxies: nuclei / galaxies: star formation
© The Authors 2026
 Open Access article, published by EDP Sciences, under the terms of the Creative Commons Attribution License (https://creativecommons.org/licenses/by/4.0), which permits unrestricted use, distribution, and reproduction in any medium, provided the original work is properly cited.
This article is published in open access under the Subscribe to Open model. This email address is being protected from spambots. You need JavaScript enabled to view it. to support open access publication.
1. Introduction
Within the commonly accepted Λ cold dark matter model, galaxies are expected to form and assemble hierarchically (e.g. White & Rees 1978; Springel et al. 2001; Moreno et al. 2013; Duncan et al. 2019). Galaxy mergers are therefore expected to be a common occurrence. In cosmological hydrodynamical simulations, about 10% of the stellar mass in a Milky Way-sized galaxy is accreted from other galaxies, and the fraction of accreted stellar mass increases to ∼60% for halos that are ten times more massive (Pillepich et al. 2018). In the local universe, a few percent of galaxies are observed to be interacting with other companions of similar mass (e.g. Lin et al. 2008; Darg et al. 2010; Lotz et al. 2011; Xu et al. 2012; López-Sanjuan et al. 2015). This further supports that mergers are a key element in the process of galaxy formation and evolution.
Mergers not only contribute to the growth of stellar mass, as interactions can alter galaxy structures and lead to the formation of more bulge-dominated systems (Toomre & Toomre 1972; Barnes & Hernquist 1996), but they can also potentially create large disk galaxies in gas-rich scenarios (Robertson et al. 2006). Mergers can enhance star formation (Scudder et al. 2012; Patton et al. 2013; Violino et al. 2018; Bickley et al. 2022; Garay-Solis et al. 2023) or act as a quenching mechanism (Springel et al. 2005; Hopkins et al. 2006; Ellison et al. 2022; Wilkinson et al. 2022). Observations show that the SFRs in close pairs are enhanced relative to a control sample of more isolated galaxies (e.g. Kartaltepe et al. 2012; Scudder et al. 2012; Patton et al. 2013; Robotham et al. 2014; Barrera-Ballesteros et al. 2015; Pan et al. 2018; Garduño et al. 2021; Steffen et al. 2021; Shah et al. 2022, among others). Most of the star formation enhancement occurs at close separations (< 30 h−1 kpc), but it can be found even at distances approaching 150 kpc (Patton et al. 2013). Numerical simulations bear this out (Mihos & Hernquist 1996; Di Matteo et al. 2005; Hopkins et al. 2008; Torrey et al. 2012; Renaud et al. 2014; Moreno et al. 2019), with Patton et al. (2020) recovering this behaviour even in the more recent IllustrisTNG dataset.
Similarly, galaxy merging could play an important role in triggering active galactic nucleus (AGN) activity (e.g. Ellison et al. 2011; Satyapal et al. 2014; Ellison et al. 2019; Mahoro et al. 2019; Bickley et al. 2023, 2024; Byrne-Mamahit et al. 2023, 2024), and these can also act to boost and/or quench star formation as well (e.g. see Zubovas & Bourne 2017; Trussler et al. 2020). However, there is still a lack of agreement in the previous results. Some studies have found no correlation between galaxy mergers and AGN triggering (Cisternas et al. 2011; Villforth et al. 2017; Marian et al. 2019; Silva et al. 2021), while others have found that AGN are statistically more likely to be in merging galaxies (Ellison et al. 2011, 2013; Lackner et al. 2014; Satyapal et al. 2014; Weston et al. 2017; Goulding et al. 2018). In addition, several works report an increase in the fraction of AGN in the population of merging galaxies for decreasing nuclear separation below 100 kpc (e.g, Ellison et al. 2011; Silverman et al. 2011; Satyapal et al. 2014), while others do not (e.g. see Shah et al. 2020 for an intermediate redshift sample and Jin et al. 2021 for local galaxies within MANGA).
If a galaxy is going to merge, it needs a companion to merge with. Hence, pairs of galaxies in close proximity can be used as a proxy for the future merger rate, although the actual merger fraction and timescales require considerable theoretical effort to simulate. An alternate approach uses the degree of morphological disturbance, but this identifies either merger remnants or objects that are already in a high stage of coalescence (see De Propris et al. 2007; Desmons et al. 2023 for a discussion and comparison of these two methods on the same samples). Both of these methods have biases that may affect results. Additionally, the number of galaxy pairs in most surveys is generally small, and it is often difficult to obtain statistically significant samples of objects with full photometric and spectroscopic coverage. Similarly, star formation and AGN indicators are not always available. Selection effects, such as disentangling close pairs, redshift incompleteness, the photometric bands used for selection, among others, can also affect the results.
In this paper, we concentrate on the galaxy pairs with the closest separation as a proxy of interacting galaxies and possible mergers, where a fraction of closer pairs (typically rp < 20 kpc and ΔV < 500 km s−1) are expected to merge within short timescales. Here we use a large sample of low spectroscopic redshift galaxy pairs at z < 0.25 covering the whole sky outside of the Galactic plane, selected at 3.4 μm and with ample redshift coverage. Above δ = −30° we have charge-coupled device photometry from the Panoramic Survey Telescope and Rapid Response System (Pan-STARRS) survey (Chambers et al. 2016), while at lower declinations we used imaging from other photometric surveys, including the Two Micron All-Sky Survey (2MASS), the Wide Field Infrared Survey Explorer (WISE), and SkyMapper. We identified galaxy pairs at various projected distances and velocity separations and then used archival Near Ultraviolet (NUV) photometry from Galaxy Evolution Explorer (GALEX) to measure star formation (Morrissey et al. 2005, 2007). To select AGN, we also used X-ray data from eROSITA (Sunyaev et al. 2021; Merloni et al. 2024), radio data from the NRAO VLA Sky Survey (NVSS) (Condon et al. 1998), mid-infrared (mid-IR) data from the unWISE survey (Lang 2014; Schlafly et al. 2019), and the Sloan Digital Sky Surveys (SDSS) spectroscopic indices where available (Baldwin et al. 1981).
We present our dataset and galaxy pair selection technique in Section 2. We show the dependence of star formation rates (SFRs) on projected separations of the galaxy pairs, as measured by the NUV − r colour in Section 3.1, and the AGN fraction in Section 3.2. Results are discussed in Section 4, and our conclusions are presented in Section 5. We adopted the latest cosmological parameters from Planck Collaboration VI (2020).
2. Data
Our photometric dataset comes from the unWISE survey (Lang 2014; Schlafly et al. 2019) in the W1 (3.4 μm) band. This has several advantages over previous datasets: It covers the entire sky, and, at this wavelength, foreground extinction is nearly negligible. Furthermore, the 3.4 μm band of WISE is dominated by the light from old stars and can be used as an effective measure of stellar mass; by selecting galaxies in this bandpass, we are essentially selecting them by stellar mass (Wen et al. 2013; Cluver et al. 2014), with minimal influence from young stars. We selected all objects classified as galaxies in the unWISE catalogue (‘spread model’ > 0.003) with W1 < 14.7 (Vega magnitudes), where the unWISE catalogue is stated to be 100% complete (Schlafly et al. 2019). We also restricted our sample to objects with |b|> 20 to avoid the crowded (and highly extincted) regions near the galactic plane. After taking all this into account, we were left with 1 526 187 galaxies in total as our photometric sample. Figure 1 (left plot) shows the distribution of all galaxies on the sky.
 |
Fig. 1. Distribution of all galaxies (left) and galaxies with redshift (right) on the sky. |
We then matched our galaxies with the NASA/IPAC Extragalactic Database Local Volume Sample (NED-LVS)1 from Cook et al. (2023) using only the collected spectroscopic redshifts for extragalactic sources from existing surveys. Typical errors in redshift are of the order of a few kilometres per second and therefore much smaller than the velocity intervals we use in this paper. We have experimented with several matching radii between the photometric and spectroscopic samples and find that the best compromise between minimising the number of lost counterparts and the number of spurious matches is a matching radius of 5″. This results in a total of 684 186 galaxies (45% of the total photometric sample) with spectroscopic redshifts from the NED-LVS. Figure 1 (right plot) shows the distribution of sources with available redshifts. Fig. 2 shows the comparison in MW1 magnitude (not dust and K-corrected due to small values of these quantities, where the W1 band may be considered a close proxy of the galaxy’s stellar mass; (see e.g. Cluver et al. 2014) between the photometric (in blue) and redshift (in red) samples.
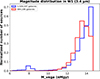 |
Fig. 2. WISE W1 magnitude comparison of the total photometric sample (blue) and the sample with spectroscopic redshifts (red), normalised by the area under the curve. |
2.1. Galaxy pairs
Following the methods detailed in Patton et al. (2000, 2002), De Propris et al. (2005, 2007), and several successive studies, we selected galaxies in two volume-limited boxes with −21 < MW1 < −24 at z < 0.03 (hereafter Box 1), and −24 < MW1 < −27 at z < 0.10 (hereafter Box 2). Fig. 4 shows the diagram of MW1 versus redshift, with galaxies selected in Box 1 and Box 2. The thick red line shows the predicted redshift evolution of a galaxy with W1 magnitude of 14.7 at z = 0 assuming a Bruzual & Charlot (2003) model with a formation redshift of 3 and e-folding time for star formation of 0.3 Gyr. This is typical of a slowly evolving early-type galaxy and therefore the slowest evolving object, which provides the magnitude limit of the survey as a function of redshift. Within these boxes we identify pairs of galaxies as a function of projected separation and velocity difference, in order to select objects that (in the closest separations) are likely to merge within short timescales (at least for a fraction of truly bound systems). The typical luminosity ratio (which is close to the mass ratio in W1) of these pairs is 1:3. Box 1 contains 33 304 galaxies while Box 2 contains 212 488 galaxies. Using the calibration by Wen et al. (2013) and Cluver et al. (2014) the central absolute W1 luminosities of −22.5 (Box 1) and −25.5 (Box 2) correspond to stellar masses of log(M/M⊙) ∼10.2 and ∼11.4, respectively. The magnitude ranges used for these two volume-limited boxes correspond to typical mass ratios of ∼1:4 (Wen et al. 2013; Cluver et al. 2014). By design, the two samples in Box 1 and 2 do not overlap and are independent of each other, and therefore, we have two samples of galaxies where we search for pairs of galaxies in two separate luminosity ranges. The typical standard deviation of W1 derived masses when compared with Galaxy And Mass Assembly (GAMA) stellar masses is about 0.5 (Cluver et al. 2014), while the GAMA and W1 derived stellar masses are in good agreement.
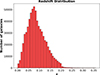 |
Fig. 3. Spectroscopic redshift distribution of the 684 186 selected galaxies. |
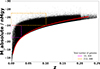 |
Fig. 4. MW1 versus spectroscopic redshift for galaxies in our sample. The red line represents the predicted evolution for a slowly evolving galaxy with W1 = 14.7 at z = 0. The violet and orange boxes define the two volume-limited samples we search for pairs in. We refer to the violet box (−21 < MW1 < −24 and z < 0.03) as Box 1 and to the orange box (−24 < MW1 < −27 and z < 0.10) as Box 2. |
Within these volume-limited samples defined by these two boxes, we search for galaxy pairs where galaxies have projected separations of rp < 20 kpc, 20 < rp < 50 kpc, 50 < rp < 100 kpc, 100 < rp < 250 kpc, and 500 < rp < 1000 kpc with velocity differences between pair members of < 500 km s−1 or 500−1000 km s−1. Only unique galaxy pairs (with closest galaxy members) are selected in this construction. The code used in the selection of galaxy pairs is publicly available on GitHub2.
This selects galaxies in pairs that are increasingly more likely to be undergoing interactions and/or to merge as a function of decreasing projected and velocity separations. According to De Propris et al. (2007, 2014), Desmons et al. (2023), at least 35% of pairs within projected separation of rp < 20 kpc are likely to be interacting and merging, while Patton et al. (2016) showed that these interactions may occur up to rp < 50 kpc. Therefore, in this work we consider galaxies in pairs with rp < 20 kpc and velocity difference of < 500 km s−1 to be a proxy of merging galaxies. On the other hand, more widely separated galaxies favour more isolated objects that are less likely to merge or interact. For example, the M31/Milky Way pair may be taken as an example of a widely separated pair that may (Cox & Loeb 2008) or may not (Sawala et al. 2025) merge within only a few giga years3. Previous studies (e.g. De Propris et al. 2007, 2014; Patton et al. 2016; Desmons et al. 2023) show that galaxies separated by more than 100−160 kpc h−1 do not show clear signs of morphological disturbance and are, therefore, much less likely to merge or interact in the near future.
Our more distant pairs (i.e. in the more distant bins on projected separation and velocity difference between the pair members) may be taken as ‘control’ samples of more isolated galaxies. A projected separation of 1 Mpc is equivalent to about 1/2 of r200 for typical nearby clusters, while a velocity difference of 1000 km s−1 is as large as their typical velocity dispersion. Patton et al. (2013) defines galaxies as isolated (for a comparison sample) if they have no bright companion within a projected distance of 2 Mpc and a velocity difference of 1000 km s−1, while Argudo-Fernández et al. (2015) show that galaxies with |ΔV|> 200 km s−1 and projected separation ≳500 kpc are very likely to be related to the underlying large-scale distribution of galaxies and therefore not interacting with each other.
We use these samples to derive the dependence of star formation and AGN activity on the projected separation and velocity difference of galaxies in pairs. Table 1 shows the number of pairs in each absolute magnitude (stellar mass) range, and separation and velocity difference subset. The total number of identified pairs in Box 1 and 2 is 12122 and 39757, respectively, with the total number of galaxies in pairs of 24244 and 79514, respectively. Note that each galaxy is only paired once.
Number of galaxy pairs as a function of projected separation, velocity difference, and absolute magnitude range.
The fraction of close pairs at rp < 20 kpc h−1 and ΔV < 500 km s−1 (that may be expected to merge within ∼1 Gyr) is approximately 2.9% for Box 1 and approximately 1% for Box 2. These values are broadly consistent with previous studies, despite possible incompleteness for closer pairs. Redshifts for pair galaxies may not be complete, especially for the closest objects, because of fibre or slit collisions. On the other hand, our redshifts come from numerous independent surveys, which should mitigate this effect. However, our interest here is in comparing the relative fractions of star-forming and AGN hosting galaxies in pairs as a function of pair members’ separation. As long as redshift incompleteness for closer pairs does not depend on the measured NUV colour, or measure of AGN activity we choose, the relative fractions of galaxies in pairs identified as star-forming, or showing signs of AGN activity, should not be affected.
2.2. Multi-wavelength data
We match the galaxies in pairs in Boxes 1 and 2 with other databases to study star formation and AGN activity, as shown in Table 2. The cross-match radius selected gives the best compromise between the number of lost counterparts and the number of spurious matches after testing for various radii (1″ − 15″) the number of counterparts using the ‘best’ and ‘all’ matches. In order to measure (NUV − r)0 colour as a proxy of star formation, we extract NUV magnitudes from GALEX DR7 All Sky Imaging Survey (AIS) (Bianchi et al. 2017) using a 5″ cross-matching radius. This is similar to the 4.5″ size of the GALEX point spread function in NUV: 86% of the GALEX sample falls within a 3″ search radius.
Number and fraction of galaxies in pairs detected in GalexPanSky (combination of GALEX, Pan-STARRS, and SkyMapper), eROSITA, NVSS, and SDSS DR8 MPA-JHU.
Optical photometry for our sources comes from the Pan-STARRS survey (Chambers et al. 2016; Flewelling et al. 2020) and from the SkyMapper Southern Sky Survey DR4 (Keller et al. 2007; Onken et al. 2024) for galaxies below δ = −30°. We use a cross-match radius of 2″ in optical, similar to the stated resolution of unWISE images (Lang 2014).
To search for AGN in our galaxies, we cross-matched our sample with X-ray and radio all-sky surveys, using the eROSITA (Sunyaev et al. 2021) and NVSS, (Condon et al. 1998), respectively. To cross-match with eROSITA data, we used a cross-match radius of 10″ to measure X-ray fluxes in the two soft 0−2.3 keV and hard 2.0−5.0 keV bands. The Half Energy Width of the eROSITA Point Spread Function (PSF) as reported by Merloni et al. (2024) is ∼30″: 58% of the eROSITA sources lie within a search radius of 5″. For NVSS data, we used a cross-match radius of 10″ to measure radio fluxes at 21 cm (1.4 GHz). The NVSS beam is 45″: 57% of the NVSS sources are within 3″ of the optical position. Foreground extinction in all bands was corrected using estimates from the NED.
Finally, we obtained the emission line ratios and AGN classifications in optical for a subset of galaxies using theBaldwin, Phillips & Terlevich (BPT) diagrams (Baldwin et al. 1981). We used the SDSS DR8 MPI-JHU catalogue4 (Brinchmann et al. 2004) and a cross-match radius of 2″. The total number of counterparts found in each survey for each box is shown in Table 2.
Total number of galaxy pairs where one or both galaxy pair members is actively forming stars, and active in X-rays, radio, and infrared for Boxes 1 and 2.
3. Results
3.1. Star formation
We used the (NUV − r)0 colour as a proxy for the degree of star formation present in each pair member. Following Yi (2008) and Hernández-Pérez & Bruzual (2014) we use (NUV − r)0 = 5.4 as the discriminant between star-forming (< 5.4) and quiescent (> 5.4) galaxies. In Table 3, we show the total number of galaxy pairs that have either one or both pair members star-forming. In Figure 5 (top) we plot violin plots (Hintze & Nelson 1998) to display the probability distribution of pair galaxies as a function of (NUV − r)0 colour for each separation and velocity difference. Violin plots visualise the probability distribution of numerical data. The width of the violin represents the density of data points at that specific value. The white dot inside the violin indicates the median while the thick dark central bar is the interquartile range (IQR). At the ends whiskers extend from the IQR to the largest and smallest values within 1.5 × IQR beyond which they are considered outliers. The overall shape of the violin reveals the distribution’s form, including peaks, flatness, or skewness. The central black bar allows us to observe the data’s spread and dispersion. We then plot the mean fractions of star-forming galaxies as a function of separation rp and velocity difference in Figure 5 (bottom). The errors in the fractions were measured following Poisson’s distribution as  , where n is the fraction of galaxies deemed to be star-forming (i.e. (NUV − r)0 < 5.4) and N is the total number of galaxies per bin. This method was applied for bins where N is greater than 30. In cases where N is less than 30, we applied the distribution described in Eq. (A.1) of Burgasser et al. (2003). In this approach, we estimated the upper bound as 84th percentile, and the lower bound as the 16th percentile. The corresponding fractions with their errors are represented in Table 4.
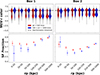 |
Fig. 5. Top: Violin plots of the distribution of (NUV − r)0 colours for galaxies in the lower mass sample (Box 1: −21 < MW1 < −24 and z < 0.03) on the left and higher mass sample (Box 2: −24 < MW1 < −27 and z < 0.10) on the right as a function of pair separation (on the X-axis) and velocity difference (red for < 500 km s−1 and blue for 500 < ΔV < 1000 km s−1). Note that we have slightly offset the two velocity samples for clarity. Galaxies below the dashed line are classified as star-forming. Bottom: Mean fraction of star-forming galaxies as a function of pair separation and velocity difference (same colour scheme as top panels) in Box 1 (left) and Box 2 (right). For the error bars see the text. |
Fraction of star-forming galaxies in pairs per separation and velocity bin.
For the lower-mass sample (Box 1), we notice, for both velocity ranges, that the fraction of star-forming galaxies declines as the projected separation decreases, flattening or slightly rising in the closest separation regime we consider (rp < 20 kpc). We observe a similar behaviour for the higher mass sample (Box 2), but the increase in star formation at closer separations (rp < 20 kpc) is more pronounced.
For the closer separations, the increase in star formation may be explained by shocks and tidal stresses compressing the interstellar medium. However, at larger separations one observes an apparent quenching of star formation from the values in the more distant galaxies in pairs. While interactions can suppress star formation, at rp > 50 kpc we see no evidence that galaxies in pairs are strongly interacting. One possibility could be that the apparent quenching reflects the somewhat denser environments in which closer pairs may reside (see Figs. 3 and 7).
In Fig. 6 we show the fractions of pairs classified as wet, mixed, and dry mergers as a function of projected separation and velocity difference. We classify pairs as wet mergers when both pair members have (NUV − r)0 < 5.4 (star-forming), as mixed mergers when one of the pair members is star forming, and as dry mergers when none of the pair members is star forming. In agreement with Fig. 5, we see a slight increase in the fraction of dry mergers and a slight decrease in that of wet mergers as rp decreases for both ΔV. In all cases, there is a slight increase in dry pairs (between red galaxies) as a function of decreasing separation and a corresponding decrease in the fraction of wet pairs, while mixed pairs are not strongly affected.
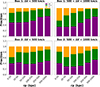 |
Fig. 6. Cumulative histogram of the wet, mixed, and dry merger fraction as a function of projected separation and velocity difference. |
3.2. Active galactic nuclei
We selected AGNs in each pair member using three different methods:
-
X-ray detections in the eROSITA soft (0−2.3 KeV) and hard (2−5 KeV) bands, where we adopted a luminosity threshold of LX > 1042 ergs s−1 as our definition of a galaxy hosting an AGNs for both soft and hard bands (Brandt & Alexander 2015; Liu et al. 2022; Birchall et al. 2022). We show the violin plots and the fractions of AGN as a function of separation for both mass ranges in Fig. 8 for the soft band, and in Fig. 9 for the hard band.
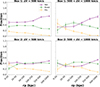
Fig. 7. Mean fractions of the wet, mixed, and dry merger as a function of projected separation and velocity difference.
-
Radio data at 1.4 GHz from the NVSS survey (only above δ = −40°), where we adopted a threshold of L > 1030 ergs s−1 Hz−1 for detecting AGN (Sadler et al. 2002; Best et al. 2005; Mauch & Sadler 2007; Condon et al. 2019). The violin plots and the fractions of radio-detected AGNs are shown in Fig. 10.
-
WISE data, where we used a colour W1 − W2 > 0.8 criterion to identify AGNs (Stern et al. 2012; Assef et al. 2013, 2018). The distribution of colours as a violin plot and the fractions of IR-detected AGN are shown in Fig. 11.
Table 3 shows the total number of galaxy pairs that have either one or both pair members as AGN selected in X-rays (soft and hard), radio, and infrared. We represent the fractions and their errors of AGN as a function of projected separation and velocity difference in Tables A.1, A.2, A.3, and A.4.
As expected, in all cases, AGN fractions are higher in the more massive sample (Box 2; e.g. Kauffmann et al. 2003; Vitale et al. 2013; Mahoro et al. 2017). Other works have reported similar trends: for instance, Pimbblet et al. (2013) finds an increase in AGN fraction by a factor of about 3 across the mass range we consider here. However, in all the AGN detection methods used, we observe only a weak trend of increased AGN activity with decrease in projected separation: the significance of the increase in AGN fraction towards lower rp is weak. There are some marginal trends for an increase in AGN fraction at closer separations for objects in our highest velocity separation bins, but we do not consider these as providing strong evidence in either case. This is consistent with recent works that favour secular processes as the trigger for most local AGN, rather than major mergers, except possibly for the more luminous quasars (Ho & Kim 2009; Hopkins & Quataert 2010; Cisternas et al. 2011; Menci et al. 2014; Villforth et al. 2017; Ellison et al. 2019; Zhao et al. 2022).
3.3. Identifying active star formation and AGNs using emission line
With the emission line indices from SDSS DR8 MPA-JHU, (York et al. 2000; Abdurro’uf et al. 2022) we identified star-forming and active galaxies using the BPT-NII diagram (Baldwin et al. 1981). These line strengths have been derived by Kewley et al. (2001), Kauffmann et al. (2003), Kewley et al. (2006), and Schawinski et al. (2007) for SDSS galaxies. Figure 12 shows the diagram (left panels) for all our pair members including all separations and velocity differences, and the fraction (right panels) of star-forming, composite, Seyfert 2, and Low-Ionisation Nuclear Emission-line Region (LINER) galaxies as a function of projected separation and velocity difference for both mass ranges we consider. In general, we find very similar trends as in Sections 3.1 and 3.2. The closest pair members with rp < 20 kpc show a modest increase in the fraction of star-forming galaxies against the next separation, with a modest increase towards the larger separations, as observed in Sect. 3.1. Similarly, we find very weak trends in Seyfert 2 and LINER fractions with pair members separation, in agreement with the previous indicators used above.
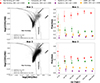 |
Fig. 12. Left: BPT-NII diagrams for our pair samples in Box 1 (top) and Box 2 (bottom), for all analysed separations and velocity differences. Right: Fraction of galaxies classified as star-forming, composite, Seyfert 2, and LINER as a function of pair separation and velocity difference in Box 1 (top) and Box 2 (bottom). The legend in figure to identifies the samples. |
We compare the three AGN-detection methods using BPT diagrams in Fig. 13. There are only a few objects in the lower mass sample (Box 1). In the higher mass sample (Box 2), X-ray AGN selection seems to be the least biased approach detecting both Seyfert 2 and LINERs, while radio selection tends to favour LINERs, and infrared selection prefers Seyfert 2 galaxies, which is in line with previous studies (e.g. Koutoulidis et al. 2013; Ji & Giavalisco 2022).
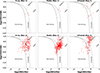 |
Fig. 13. Comparison of BPT-NII diagram to our AGN samples detected in soft (0.2−2.3 keV) X-rays (left), radio (middle), and infrared (right) in Box 1 (top) and Box 2 (bottom). |
3.4. Morphologies of pair galaxies
Close galaxy pairs are only one of the methods employed to find possible merging galaxies. The structure and morphology of galaxies can be easily altered by close encounters, leaving asymmetric features such as tidal tails (Toomre & Toomre 1972; Huang & Fan 2022). Morphological disturbances are common in merging and post-merging systems (e.g. Conselice 2003; Pawlik et al. 2016). As mentioned above, De Propris et al. (2007) looked for signs of morphological disturbance in dynamically close pairs and estimate a lower limit of 35% to the true merger fraction, while 53% of the close pairs in Desmons et al. (2023) exhibit tidal features. It was suggested that samples that are restricted to interacting and merging galaxies show a greater prevalence of starbursts and AGN (e.g. Cezar et al. 2024; Robin et al. 2024).
We classified galaxies in pairs using images from the Pan-STARRS and Skymapper surveys. We classified galaxy pair members into three classes, as strongly interacting, weakly interacting, and non-interacting (or undisturbed), as shown in Fig. 14. Strongly interacting galaxies as in the top row of Fig. 14 are observed to have visible morphological disturbances, irregular morphologies and prominent tidal tails. For weakly interacting galaxies, we only observe tidal tails and relatively small asymmetries in the light distribution, while undisturbed galaxies do not appear to show any distortion. We classified all objects in Box 1, and 10% of all objects were randomly selected in each pair separation class in Box 2. In Box 1, the total numbers of strongly interacting, weakly interacting, and non-interacting galaxy pairs are 167 125, and 11 830, respectively, while in Box 2 they are 233 304, and 5010, respectively. Only pairs with rp < 50 kpc are seen to contain disturbed systems as shown in Figure 15 (although this may be affected by the limitation of the available imaging). Between 40% and 50% of pairs with rp < 20 kpc and ΔV < 500 km/s are seen to be strongly interacting as shown in Figure 16, almost independently of the mass range selected, in agreement with Desmons et al. (2023).
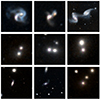 |
Fig. 14. Examples of strongly interacting (top), weakly interacting (middle), and undisturbed galaxies in pairs (bottom) from PanStarrs images of our sample. |
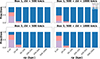 |
Fig. 15. Fraction of galaxies corresponding to the classes 1, 2, and 3 for strongly interacting, weakly interacting, and not interacting, respectively, for boxes 1 (top) and 2 (bottom) for two velocity differences (left and right plots). |
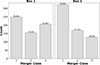 |
Fig. 16. Merger class distribution for box 1 (left), and box 2 (right). Numbers 1, 2, and 3 correspond to strongly interacting, weakly interacting, and non-interacting galaxies pairs, respectively, in the closest separations (rp < 20 kpc and ΔV < 500 km/s). |
We can now ask whether objects selected as interacting do show evidence of increased star formation activity or the presence of AGN, as in Ellison et al. (2024, 2025), for example. We plot the mean fractions of star-forming galaxies using the (NUV − r)0 < 5.4 diagnostic for all merger classes and for rp < 50 kpc in Fig. 17. The trends we observed for all three classes are similar to those we observed for the entire sample in Fig. 5: There is no strong evidence that star formation increases in pair galaxies as they ‘approach’ each other, suggesting that even for closely separated pairs with clear signs of interaction, the process does not suffice to induce strong star formation episodes.
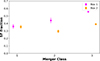 |
Fig. 17. Mean fraction of star-forming galaxies in strongly interacting (class 1), weakly interacting (class 2) and undisturbed (class 3) galaxies in pairs in Box 1 (violet) and Box 2 (orange) at rp < 50 kpc separation and all velocity differences. Errors are measured as in Sect. 3.1. |
We repeat the same procedure for AGN using all three selection methods in Fig. 18. However, we have to bundle all pairs with rp < 50 kpc and all velocity differences, due to the relatively smaller number of detected objects. The results are also broadly consistent with AGN fractions found in Figs. 8, 9, 10, and 11, suggesting that even in closely interacting pairs that are more likely to merge in the near future, AGN activity is not significantly affected.
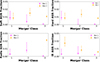 |
Fig. 18. Mean AGN fractions for pairs with rp < 50 kpc separation and all velocity differences, detected in soft X-rays (top left), hard X-rays (top right), radio (bottom left), and infrared (bottom right). The colour scheme and identifications of objects are as in Fig. 17. |
4. Discussion
In this work we have compared SFRs and indicators of AGN activity in samples of progressively closer dynamical galaxy pairs, selected from the unWISE survey to define a mass-selected sample. We compare two absolute magnitude ranges, centred on MW1 = −22.5 and −25.5 and over 1.5 mag either side, to select major mergers with typical magnitude luminosity ratio of 1:3 corresponding to a typical stellar mass ratio 1:4. The centre of these two magnitude ranges correspond to stellar masses of log(M*/M⊙)∼10.2 and ∼11.4 with redshifts of z < 0.03 and z < 0.1, respectively.
For both samples, we observe that the star formation activity, as measured from the NUV − r colour, declines as the galaxies in pairs become closer in projected separation and velocity difference, and then rises slightly in the closer bins (rp < 50 kpc), mainly for the more massive sample. Unlike some previous studies (e.g. Patton et al. 2013), we only see this at small projected separations and velocity differences, and not at larger separations. The apparent decline in star formation (e.g. Fig. 5) with decreasing separation is likely not due to interactions (which seem to affect morphology only for rp < 50 kpc as in Section 3.4). When pairs become close enough, evidence for a relative increase in star formation at rp < 20 kpc is observed in both mass samples and even for the separate velocity ranges we consider, although more strongly in the more massive sample. An increase in star formation at close separations has been detected in several other studies (e.g. Li et al. 2008; Patton et al. 2013; Barrera-Ballesteros et al. 2015; Feng et al. 2019; Patton et al. 2020), with claims that the enhancement extends to distances of up to 150 kpc. Here we find that only in the closest separations (rp < 50 kpc) bin star formation is enhanced, while the fraction of galaxies in pairs that are star-forming actually declines as pair separation decreases. Suppression of star formation in close pairs (rp < 100 kpc) has also been observed by Feng et al. (2024) using SDSS DR7 data, who argue that the suppression in star formation may be due to hydrodynamic effects, including tides, ram stripping from the hot circumgalactic medium and the structure of the pair galaxies.
While there are some points of agreement with previous work there are also areas where our results differ. We note here that our sample and analysis are different in some respects from previous studies: it is selected by stellar mass using as a proxy data at 3.4 μm, we measure star formation from NUV colours that are arguably a more reliable and direct measure of star formation over the past ∼1 Gyr (Kaviraj et al. 2007), and we use a wide range of AGN indicators (X-ray and radio fluxes, infrared colours and line ratios in BPT diagrams), yielding similar results.
Our comparison sample also consists of the wider pairs from the same survey material rather than galaxies selected to be isolated in matched samples (in redshift, stellar mass and environment as in Argudo-Fernández et al. 2015; Patton et al. 2013). By construction our samples of galaxies in pairs at increasing separation are matched in redshift and stellar mass (as they are derived from the same material): at rp > 200 kpc these pairs can be considered as non-interacting and effectively isolated (with respect to similarly massive galaxies), while we argue that we likely probe denser environments for closer pairs and that this accounts for the observed trend of quenching as galaxies become closer.
We also note the excellent agreement of our results with the recent work by Omori et al. (2025) who studied close pairs in the Hyper Suprime Cam Subaru Strategic Program to investigate the merger-SFR-AGN connection in galaxy pairs and found little difference in AGN and star formation activity between close pair galaxies and isolated galaxies. It is only among objects that are classified as post-mergers that any sign of significantly increased activity is observed in agreement with Ellison et al. (2024, 2025).
Simulations (e.g. Mihos & Hernquist 1996; Hopkins et al. 2008; Scudder et al. 2012; Moreno et al. 2019) show that interactions and mergers cause strong gravitational torques, possibly resulting in nuclear starbursts (Renaud et al. 2015; Moreno et al. 2021) and the triggering of AGN. As already mentioned above, while some observations have claimed that the fraction of AGN increases in close galaxy pairs (Ellison et al. 2011, 2013; Satyapal et al. 2014; Weston et al. 2017), others have not supported this claim (Shah et al. 2020; Jin et al. 2021). We find no strong evidence that AGN activity increases as a function of pair separation. This is consistent with the hypothesis that, at least at lower redshifts, secular processes may be more important than mergers in triggering AGN activity (e.g. Menci et al. 2014; Mahoro et al. 2017, 2019; Hickox & Alexander 2018). Even in the simulations by McAlpine et al. (2020) the AGN enhancement in pairs is modest. Most of the star formation and AGN activity may occur post-coalescence (Ellison et al. 2024, 2025) rather than during the early interaction phase (e.g. see Omori et al. 2025). However, post-starburst galaxies (usually considered as merger or interaction remnants) do not generally host powerful AGN (Nielsen et al. 2012; De Propris & Melnick 2014; Lanz et al. 2022; Almaini et al. 2025).
As a test of our hypothesis, we have extracted a sample of pairs of similar masses from the z = 0.1 snapshot of the Illustris-TNG300 simulations (Pillepich et al. 2018). First, we notice that the simulation identifies more pairs at closer separation than what we obtain from observations, a result also observed by Faria et al. (2025). We plot star formation and bolometric AGN luminosity as a function of 3D pair separation in Figs. 19 and 20, respectively.
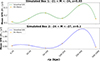 |
Fig. 19. Smoothed SFRs for galaxies in pairs from the Illustris-TNG simulation versus 3D separation for simulated Box 1 (top) and Box 2 (bottom). |
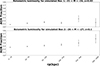 |
Fig. 20. Bolometric luminosity of luminous AGNs (LBol > 1044 erg/s) for galaxies in pairs from the Illustris-TNG simulation versus 3D separation for simulated Box 1 (top) and Box 2 (bottom). |
Star formation is observed to decline as a function of pair separation, albeit more sharply than we observe. However, we see no strong enhancement in star formation at closer separation, while we observe a modest increase at rp < 20 kpc. This is different in some respects from previous work and we suggest that selection by stellar mass and the use of the NUV colours to assess star formation plays at least some role in our results.
In agreement with our observations, there is little or no AGN enhancement as a function of decreasing separation between galaxies in pairs. This is consistent with some simulations, while others claim a stronger effect (e.g. Steinborn et al. 2016).
5. Conclusions
We have selected a large sample of galaxy pairs with six ranges of projected separations within 0 < rp < 1000 kpc and two velocity ranges within 0 < ΔV < 1000 km s−1 from the unWISE survey (Lang 2014; Schlafly et al. 2019) and with redshifts of z < 0.25 from the NED-LVS compilation of Cook et al. (2023). We found 12 122 pairs with a luminosity ratio of 1:3 at MW1 = −22.5 ± 1.5 mag and 39 757 pairs at MW1 = −25.5 ± 1.5 with z < 0.03 and z < 0.10, respectively. We compared the fractions of star-forming galaxies in pairs and AGN activity as a function of pair separation (in a relative sense, rather than absolute values).
By comparing star formation as a function of pair separation and velocity differences in Figure 5, we found evidence for a decline in star formation as galaxies in pairs become closer, probably due to environmental effects, as there is no evidence of interactions at rp > 50 kpc that may cause quenching, and then a modest increase at closer separations (i.e. rp ≲ 50 kpc) likely due to the interaction between the pair members. We also find no strong evidence for an increase in AGN activity when AGNs are selected by different methods (X-ray, radio, infrared, and optical) as shown in Figures 8, 9, 10, 11, and 12, suggesting that galaxy interactions do not highly enhance AGN activity and may be triggered by secular processes in the local Universe.
Acknowledgments
We thank the anonymous referees for accepting to review this paper and for providing constructive and valuable comments that improved the manuscript. We acknowledge Emmanuel Bempong from the University of Manchester, and Betelehem Bilata and Jaime Perea from the IAA-CSIC for the assistance in running the part of the code that required supercomputers. JC and RdP acknowledge the financial support from the Education, Audio and Cultural Executive Agency of the European Commission through the Pan-African Planetary and Space Science Network (PAPSSN) under funding agreement number 62421.24-PANAF-12020-1-BW-PANAF-MOBAF. MP acknowledges the support from the Spanish Ministerio de Ciencia e Innovación-Agencia Estatal de Investigación through projects PID2022-140871NB-C21 and PID2024-162972NB-I00, the State Agency for Research of the Spanish MCIU through the Center of Excellence Severo Ochoa award to the Instituto de Astrofísica de Andalucía (CEX2021-001131-S funded by MCIN/AEI/10.13039/501100011033), and the Space Science and Geospatial Institute (SSGI) under the Ethiopian Ministry of Innovation and Technology (MInT). This publication makes use of data products from the Wide-field Infrared Survey Explorer, which is a joint project of the University of California, Los Angeles, and the Jet Propulsion Laboratory/California Institute of Technology, funded by the National Aeronautics and Space Administration. This research also made use of the NASA/IPAC Extragalactic Database (NED), which is operated by the Jet Propulsion Laboratory, California Institute of Technology, under contract with the National Aeronautics and Space Administration. The Pan-STARRS1 Surveys (PS1) and the PS1 public science archive have been made possible through contributions by the Institute for Astronomy, the University of Hawaii, the Pan-STARRS Project Office, the Max-Planck Society and its participating institutes, The Johns Hopkins University, Durham University, the University of Edinburgh, the Queen’s University Belfast, the Harvard-Smithsonian Center for Astrophysics, the Las Cumbres Observatory Global Telescope Network Incorporated, the National Central University of Taiwan, the Space Telescope Science Institute, the National Aeronautics and Space Administration under Grant No. NNX08AR22G issued through the Planetary Science Division of the NASA Science Mission Directorate, the National Science Foundation Grant No. AST–1238877, the University of Maryland, Eotvos Lorand University (ELTE), the Los Alamos National Laboratory, and the Gordon and Betty Moore Foundation. The National Radio Astronomy Observatory is a facility of the National Science Foundation operated under cooperative agreement by Associated Universities, Inc. The national facility capability for SkyMapper has been funded through ARC LIEF grant LE130100104 from the Australian Research Council, awarded to the University of Sydney, the Australian National University, Swinburne University of Technology, the University of Queensland, the University of Western Australia, the University of Melbourne, Curtin University of Technology, Monash University and the Australian Astronomical Observatory. SkyMapper is owned and operated by The Australian National University’s Research School of Astronomy and Astrophysics. The survey data were processed and provided by the SkyMapper Team at ANU. The SkyMapper node of the All-Sky Virtual Observatory (ASVO) is hosted at the National Computational Infrastructure (NCI). Development and support of the SkyMapper node of the ASVO has been funded in part by Astronomy Australia Limited (AAL) and the Australian Government through the Commonwealth’s Education Investment Fund (EIF) and National Collaborative Research Infrastructure Strategy (NCRIS), particularly the National eResearch Collaboration Tools and Resources (NeCTAR) and the Australian National Data Service Projects (ANDS). This work also used data from eROSITA, the X-ray instrument aboard SRG, a joint Russian-German science mission supported by the Russian Space Agency (Roskosmos), in the interests of the Russian Academy of Sciences represented by its Space Research Institute (IKI), and the Deutsches Zentrum für Luft- und Raumfahrt (DLR). The development and construction of the eROSITA X-ray instrument was led by MPE, with contributions from the Dr. Karl Remeis Observatory Bamberg & ECAP (FAU Erlangen-Nuernberg), the University of Hamburg Observatory, the Leibniz Institute for Astrophysics Potsdam (AIP), and the Institute for Astronomy and Astrophysics of the University of Tübingen, with the support of DLR and the Max Planck Society. The Argelander Institute for Astronomy of the University of Bonn and the Ludwig Maximilians Universität Munich also participated in the science preparation for eROSITA. GALEX is operated for NASA by the California Institute of Technology under NASA contract NAS5-98034.
References
- Abdurro’uf, Accetta, K., Aerts, C., et al. 2022, ApJS, 259, 35 [NASA ADS] [CrossRef] [Google Scholar]
- Almaini, O., Wild, V., Maltby, D., et al. 2025, MNRAS, 539, 3568 [Google Scholar]
- Argudo-Fernández, M., Verley, S., Bergond, G., et al. 2015, A&A, 578, A110 [NASA ADS] [CrossRef] [EDP Sciences] [Google Scholar]
- Assef, R. J., Stern, D., Kochanek, C. S., et al. 2013, ApJ, 772, 26 [Google Scholar]
- Assef, R. J., Stern, D., Noirot, G., et al. 2018, ApJS, 234, 23 [Google Scholar]
- Baldwin, J. A., Phillips, M. M., & Terlevich, R. 1981, PASP, 93, 5 [Google Scholar]
- Barnes, J. E., & Hernquist, L. 1996, ApJ, 471, 115 [NASA ADS] [CrossRef] [Google Scholar]
- Barrera-Ballesteros, J. K., Sánchez, S. F., García-Lorenzo, B., et al. 2015, A&A, 579, A45 [NASA ADS] [CrossRef] [EDP Sciences] [Google Scholar]
- Best, P. N., Kauffmann, G., Heckman, T. M., & Ivezić, Ž. 2005, MNRAS, 362, 9 [Google Scholar]
- Bianchi, L., Shiao, B., & Thilker, D. 2017, ApJS, 230, 24 [Google Scholar]
- Bickley, R. W., Ellison, S. L., Patton, D. R., et al. 2022, MNRAS, 514, 3294 [NASA ADS] [CrossRef] [Google Scholar]
- Bickley, R. W., Ellison, S. L., Patton, D. R., & Wilkinson, S. 2023, MNRAS, 519, 6149 [CrossRef] [Google Scholar]
- Bickley, R. W., Ellison, S. L., Salvato, M., et al. 2024, MNRAS, 533, 3068 [Google Scholar]
- Birchall, K. L., Watson, M. G., Aird, J., & Starling, R. L. C. 2022, MNRAS, 510, 4556 [NASA ADS] [CrossRef] [Google Scholar]
- Brandt, W. N., & Alexander, D. M. 2015, A&ARv, 23, 1 [Google Scholar]
- Brinchmann, J., Charlot, S., White, S. D., et al. 2004, MNRAS, 351, 1151 [NASA ADS] [CrossRef] [Google Scholar]
- Bruzual, G., & Charlot, S. 2003, MNRAS, 344, 1000 [NASA ADS] [CrossRef] [Google Scholar]
- Burgasser, A. J., Kirkpatrick, J. D., Reid, I. N., et al. 2003, ApJ, 586, 512 [Google Scholar]
- Byrne-Mamahit, S., Hani, M. H., Ellison, S. L., Quai, S., & Patton, D. R. 2023, MNRAS, 519, 4966 [NASA ADS] [CrossRef] [Google Scholar]
- Byrne-Mamahit, S., Patton, D. R., Ellison, S. L., et al. 2024, MNRAS, 528, 5864 [Google Scholar]
- Cezar, P. H., Pastoriza, M. G., Riffel, R., et al. 2024, A&A, 689, A312 [NASA ADS] [CrossRef] [EDP Sciences] [Google Scholar]
- Chambers, K. C., Magnier, E. A., Metcalfe, N., et al. 2016, ArXiv e-prints [arXiv:1612.05560] [Google Scholar]
- Cisternas, M., Jahnke, K., Inskip, K. J., et al. 2011, ApJ, 726, 57 [NASA ADS] [CrossRef] [Google Scholar]
- Cluver, M. E., Jarrett, T. H., Hopkins, A. M., et al. 2014, ApJ, 782, 90 [Google Scholar]
- Condon, J. J., Cotton, W. D., Greisen, E. W., et al. 1998, AJ, 115, 1693 [Google Scholar]
- Condon, J. J., Matthews, A. M., & Broderick, J. J. 2019, ApJ, 872, 148 [NASA ADS] [CrossRef] [Google Scholar]
- Conselice, C. J. 2003, ApJS, 147, 1 [NASA ADS] [CrossRef] [Google Scholar]
- Cook, D. O., Mazzarella, J. M., Helou, G., et al. 2023, ApJS, 268, 14 [NASA ADS] [CrossRef] [Google Scholar]
- Cox, T. J., & Loeb, A. 2008, MNRAS, 386, 461 [NASA ADS] [CrossRef] [Google Scholar]
- Darg, D. W., Kaviraj, S., Lintott, C. J., et al. 2010, MNRAS, 401, 1552 [NASA ADS] [CrossRef] [Google Scholar]
- De Propris, R., & Melnick, J. 2014, MNRAS, 439, 2837 [NASA ADS] [CrossRef] [Google Scholar]
- De Propris, R., Liske, J., Driver, S. P., Allen, P. D., & Cross, N. J. G. 2005, AJ, 130, 1516 [NASA ADS] [CrossRef] [Google Scholar]
- De Propris, R., Conselice, C. J., Liske, J., et al. 2007, ApJ, 666, 212 [NASA ADS] [CrossRef] [Google Scholar]
- De Propris, R., Baldry, I. K., Bland-Hawthorn, J., et al. 2014, MNRAS, 444, 2200 [NASA ADS] [CrossRef] [Google Scholar]
- Desmons, A., Brough, S., Martínez-Lombilla, C., et al. 2023, MNRAS, 523, 4381 [CrossRef] [Google Scholar]
- Di Matteo, T., Springel, V., & Hernquist, L. 2005, Nature, 433, 604 [NASA ADS] [CrossRef] [Google Scholar]
- Duncan, K., Conselice, C. J., Mundy, C., et al. 2019, ApJ, 876, 110 [NASA ADS] [CrossRef] [Google Scholar]
- Ellison, S. L., Patton, D. R., Mendel, J. T., & Scudder, J. M. 2011, MNRAS, 418, 2043 [NASA ADS] [CrossRef] [Google Scholar]
- Ellison, S. L., Mendel, J. T., Scudder, J. M., Patton, D. R., & Palmer, M. J. D. 2013, MNRAS, 430, 3128 [NASA ADS] [CrossRef] [Google Scholar]
- Ellison, S. L., Viswanathan, A., Patton, D. R., et al. 2019, MNRAS, 487, 2491 [NASA ADS] [CrossRef] [Google Scholar]
- Ellison, S. L., Wilkinson, S., Woo, J., et al. 2022, MNRAS, 517, L92 [NASA ADS] [CrossRef] [Google Scholar]
- Ellison, S., Ferreira, L., Wild, V., et al. 2024, Open J. Astrophys., 7, 121 [Google Scholar]
- Ellison, S., Ferreira, L., Bickley, R., et al. 2025, Open J. Astrophys., 8, 12 [Google Scholar]
- Faria, L., Patton, D. R., Courteau, S., Ellison, S., & Brown, W. 2025, MNRAS, 537, 915 [Google Scholar]
- Feng, S., Shen, S.-Y., Yuan, F.-T., et al. 2019, ApJ, 880, 114 [Google Scholar]
- Feng, S., Shen, S.-Y., Yuan, F.-T., et al. 2024, ApJ, 965, 60 [Google Scholar]
- Flewelling, H. A., Magnier, E. A., Chambers, K. C., et al. 2020, ApJS, 251, 7 [NASA ADS] [CrossRef] [Google Scholar]
- Garay-Solis, Y., Barrera-Ballesteros, J. K., Colombo, D., et al. 2023, ApJ, 952, 122 [Google Scholar]
- Garduño, L. E., Lara-López, M. A., López-Cruz, O., et al. 2021, MNRAS, 501, 2969 [CrossRef] [Google Scholar]
- Goulding, A. D., Greene, J. E., Bezanson, R., et al. 2018, PASJ, 70, S37 [NASA ADS] [CrossRef] [Google Scholar]
- Hernández-Pérez, F., & Bruzual, G. 2014, MNRAS, 444, 2571 [Google Scholar]
- Hickox, R. C., & Alexander, D. M. 2018, ARA&A, 56, 625 [Google Scholar]
- Hintze, J. L., & Nelson, R. D. 1998, Am. Stat., 52, 181 [CrossRef] [Google Scholar]
- Ho, L. C., & Kim, M. 2009, ApJS, 184, 398 [NASA ADS] [CrossRef] [Google Scholar]
- Hopkins, P. F., & Quataert, E. 2010, MNRAS, 407, 1529 [Google Scholar]
- Hopkins, P. F., Somerville, R. S., Hernquist, L., et al. 2006, ApJ, 652, 864 [NASA ADS] [CrossRef] [Google Scholar]
- Hopkins, P. F., Hernquist, L., Cox, T. J., & Kereš, D. 2008, ApJS, 175, 356 [Google Scholar]
- Huang, Q., & Fan, L. 2022, ApJS, 262, 39 [NASA ADS] [CrossRef] [Google Scholar]
- Ji, Z., & Giavalisco, M. 2022, ApJ, 935, 120 [NASA ADS] [CrossRef] [Google Scholar]
- Jin, G., Dai, Y. S., Pan, H.-A., et al. 2021, ApJ, 923, 6 [NASA ADS] [CrossRef] [Google Scholar]
- Kartaltepe, J. S., Dickinson, M., Alexander, D. M., et al. 2012, ApJ, 757, 23 [CrossRef] [Google Scholar]
- Kauffmann, G., Heckman, T. M., White, S. D. M., et al. 2003, MNRAS, 341, 33 [Google Scholar]
- Kaviraj, S., Schawinski, K., Devriendt, J. E. G., et al. 2007, ApJS, 173, 619 [NASA ADS] [CrossRef] [Google Scholar]
- Keller, S. C., Schmidt, B. P., Bessell, M. S., et al. 2007, PASA, 24, 1 [NASA ADS] [CrossRef] [Google Scholar]
- Kewley, L. J., Dopita, M. A., Sutherland, R. S., Heisler, C. A., & Trevena, J. 2001, ApJ, 556, 121 [Google Scholar]
- Kewley, L. J., Groves, B., Kauffmann, G., & Heckman, T. 2006, MNRAS, 372, 961 [Google Scholar]
- Koutoulidis, L., Plionis, M., Georgantopoulos, I., & Fanidakis, N. 2013, MNRAS, 428, 1382 [NASA ADS] [CrossRef] [Google Scholar]
- Lackner, C. N., Silverman, J. D., Salvato, M., et al. 2014, AJ, 148, 137 [NASA ADS] [CrossRef] [Google Scholar]
- Lang, D. 2014, AJ, 147, 108 [Google Scholar]
- Lanz, L., Stepanoff, S., Hickox, R. C., et al. 2022, ApJ, 935, 29 [Google Scholar]
- Li, C., Kauffmann, G., Heckman, T. M., White, S. D. M., & Jing, Y. P. 2008, MNRAS, 385, 1915 [CrossRef] [Google Scholar]
- Lin, L., Patton, D. R., Koo, D. C., et al. 2008, ApJ, 681, 232 [Google Scholar]
- Liu, T., Buchner, J., Nandra, K., et al. 2022, A&A, 661, A5 [NASA ADS] [CrossRef] [EDP Sciences] [Google Scholar]
- López-Sanjuan, C., Cenarro, A. J., Varela, J., et al. 2015, A&A, 576, A53 [Google Scholar]
- Lotz, J. M., Jonsson, P., Cox, T. J., et al. 2011, ApJ, 742, 103 [Google Scholar]
- Mahoro, A., Pović, M., & Nkundabakura, P. 2017, MNRAS, 471, 3226 [Google Scholar]
- Mahoro, A., Pović, M., Nkundabakura, P., Nyiransengiyumva, B., & Väisänen, P. 2019, MNRAS, 485, 452 [NASA ADS] [CrossRef] [Google Scholar]
- Marian, V., Jahnke, K., Mechtley, M., et al. 2019, ApJ, 882, 141 [CrossRef] [Google Scholar]
- Mauch, T., & Sadler, E. M. 2007, MNRAS, 375, 931 [Google Scholar]
- McAlpine, S., Harrison, C. M., Rosario, D. J., et al. 2020, MNRAS, 494, 5713 [NASA ADS] [CrossRef] [Google Scholar]
- Menci, N., Gatti, M., Fiore, F., & Lamastra, A. 2014, A&A, 569, A37 [NASA ADS] [CrossRef] [EDP Sciences] [Google Scholar]
- Merloni, A., Lamer, G., Liu, T., et al. 2024, A&A, 682, A34 [NASA ADS] [CrossRef] [EDP Sciences] [Google Scholar]
- Mihos, J. C., & Hernquist, L. 1996, ApJ, 464, 641 [Google Scholar]
- Moreno, J., Bluck, A. F. L., Ellison, S. L., et al. 2013, MNRAS, 436, 1765 [NASA ADS] [CrossRef] [Google Scholar]
- Moreno, J., Torrey, P., Ellison, S. L., et al. 2019, MNRAS, 485, 1320 [NASA ADS] [CrossRef] [Google Scholar]
- Moreno, J., Torrey, P., Ellison, S. L., et al. 2021, MNRAS, 503, 3113 [NASA ADS] [CrossRef] [Google Scholar]
- Morrissey, P., Schiminovich, D., Barlow, T. A., et al. 2005, ApJ, 619, L7 [CrossRef] [Google Scholar]
- Morrissey, P., Conrow, T., Barlow, T. A., et al. 2007, ApJS, 173, 682 [Google Scholar]
- Nielsen, D. M., Ridgway, S. E., De Propris, R., & Goto, T. 2012, ApJ, 761, L16 [NASA ADS] [CrossRef] [Google Scholar]
- Omori, K. C., Bottrell, C., Bellstedt, S., et al. 2025, ApJ, 989, 73 [Google Scholar]
- Onken, C. A., Wolf, C., Bessell, M. S., et al. 2024, PASA, 41, e061 [NASA ADS] [CrossRef] [Google Scholar]
- Pan, H.-A., Lin, L., Hsieh, B.-C., et al. 2018, ApJ, 868, 132 [Google Scholar]
- Patton, D. R., Carlberg, R. G., Marzke, R. O., et al. 2000, ApJ, 536, 153 [NASA ADS] [CrossRef] [Google Scholar]
- Patton, D. R., Pritchet, C. J., Carlberg, R. G., et al. 2002, ApJ, 565, 208 [CrossRef] [Google Scholar]
- Patton, D. R., Torrey, P., Ellison, S. L., Mendel, J. T., & Scudder, J. M. 2013, MNRAS, 433, L59 [CrossRef] [Google Scholar]
- Patton, D. R., Qamar, F. D., Ellison, S. L., et al. 2016, MNRAS, 461, 2589 [NASA ADS] [CrossRef] [Google Scholar]
- Patton, D. R., Wilson, K. D., Metrow, C. J., et al. 2020, MNRAS, 494, 4969 [NASA ADS] [CrossRef] [Google Scholar]
- Pawlik, M. M., Wild, V., Walcher, C. J., et al. 2016, MNRAS, 456, 3032 [NASA ADS] [CrossRef] [Google Scholar]
- Pillepich, A., Springel, V., Nelson, D., et al. 2018, MNRAS, 473, 4077 [Google Scholar]
- Pimbblet, K. A., Shabala, S. S., Haines, C. P., Fraser-McKelvie, A., & Floyd, D. J. E. 2013, MNRAS, 429, 1827 [NASA ADS] [CrossRef] [Google Scholar]
- Planck Collaboration VI. 2020, A&A, 641, A6 [NASA ADS] [CrossRef] [EDP Sciences] [Google Scholar]
- Renaud, F., Bournaud, F., Kraljic, K., & Duc, P. A. 2014, MNRAS, 442, L33 [NASA ADS] [CrossRef] [Google Scholar]
- Renaud, F., Bournaud, F., & Duc, P.-A. 2015, MNRAS, 446, 2038 [Google Scholar]
- Robertson, B., Bullock, J. S., Cox, T. J., et al. 2006, ApJ, 645, 986 [NASA ADS] [CrossRef] [Google Scholar]
- Robin, T., Kartha, S. S., Akhil Krishna, R., et al. 2024, MNRAS, 534, 1902 [Google Scholar]
- Robotham, A. S. G., Driver, S. P., Davies, L. J. M., et al. 2014, MNRAS, 444, 3986 [NASA ADS] [CrossRef] [Google Scholar]
- Sadler, E. M., Jackson, C. A., Cannon, R. D., et al. 2002, MNRAS, 329, 227 [Google Scholar]
- Satyapal, S., Ellison, S. L., McAlpine, W., et al. 2014, MNRAS, 441, 1297 [Google Scholar]
- Sawala, T., Delhomelle, J., Deason, A. J., et al. 2025, Nat. Astron., 9, 1206 [Google Scholar]
- Schawinski, K., Thomas, D., Sarzi, M., et al. 2007, MNRAS, 382, 1415 [Google Scholar]
- Schlafly, E. F., Meisner, A. M., & Green, G. M. 2019, ApJS, 240, 30 [Google Scholar]
- Scudder, J. M., Ellison, S. L., Torrey, P., Patton, D. R., & Mendel, J. T. 2012, MNRAS, 426, 549 [NASA ADS] [CrossRef] [Google Scholar]
- Shah, E. A., Kartaltepe, J. S., Magagnoli, C. T., et al. 2020, ApJ, 904, 107 [NASA ADS] [CrossRef] [Google Scholar]
- Shah, E. A., Kartaltepe, J. S., Magagnoli, C. T., et al. 2022, ApJ, 940, 4 [NASA ADS] [CrossRef] [Google Scholar]
- Silva, A., Marchesini, D., Silverman, J. D., et al. 2021, ApJ, 909, 124 [Google Scholar]
- Silverman, J. D., Kampczyk, P., Jahnke, K., et al. 2011, ApJ, 743, 2 [NASA ADS] [CrossRef] [Google Scholar]
- Springel, V., Yoshida, N., & White, S. D. M. 2001, New Astron., 6, 79 [Google Scholar]
- Springel, V., Di Matteo, T., & Hernquist, L. 2005, MNRAS, 361, 776 [Google Scholar]
- Steffen, J. L., Fu, H., Comerford, J. M., et al. 2021, ApJ, 909, 120 [NASA ADS] [CrossRef] [Google Scholar]
- Steinborn, L. K., Dolag, K., Comerford, J. M., et al. 2016, MNRAS, 458, 1013 [Google Scholar]
- Stern, D., Assef, R. J., Benford, D. J., et al. 2012, ApJ, 753, 30 [Google Scholar]
- Sunyaev, R., Arefiev, V., Babyshkin, V., et al. 2021, A&A, 656, A132 [NASA ADS] [CrossRef] [EDP Sciences] [Google Scholar]
- Toomre, A., & Toomre, J. 1972, ApJ, 178, 623 [Google Scholar]
- Torrey, P., Cox, T. J., Kewley, L., & Hernquist, L. 2012, ApJ, 746, 108 [NASA ADS] [CrossRef] [Google Scholar]
- Trussler, J., Maiolino, R., Maraston, C., et al. 2020, MNRAS, 491, 5406 [Google Scholar]
- Villforth, C., Hamilton, T., Pawlik, M. M., et al. 2017, MNRAS, 466, 812 [NASA ADS] [CrossRef] [Google Scholar]
- Violino, G., Ellison, S. L., Sargent, M., et al. 2018, MNRAS, 476, 2591 [NASA ADS] [CrossRef] [Google Scholar]
- Vitale, M., Mignoli, M., Cimatti, A., et al. 2013, A&A, 556, A11 [NASA ADS] [CrossRef] [EDP Sciences] [Google Scholar]
- Wen, X.-Q., Wu, H., Zhu, Y.-N., et al. 2013, MNRAS, 433, 2946 [NASA ADS] [CrossRef] [Google Scholar]
- Weston, M. E., McIntosh, D. H., Brodwin, M., et al. 2017, MNRAS, 464, 3882 [NASA ADS] [CrossRef] [Google Scholar]
- White, S. D. M., & Rees, M. J. 1978, MNRAS, 183, 341 [Google Scholar]
- Wilkinson, S., Ellison, S. L., Bottrell, C., et al. 2022, MNRAS, 516, 4354 [CrossRef] [Google Scholar]
- Xu, C. K., Zhao, Y., Scoville, N., et al. 2012, ApJ, 747, 85 [Google Scholar]
- Yi, S. K. 2008, ASP Conf. Ser., 392, 3 [NASA ADS] [Google Scholar]
- York, D. G., Adelman, J., Anderson, J. E., et al. 2000, AJ, 120, 1579 [Google Scholar]
- Zhao, Y., Li, Y. A., Shangguan, J., Zhuang, M.-Y., & Ho, L. C. 2022, ApJ, 925, 70 [Google Scholar]
- Zubovas, K., & Bourne, M. A. 2017, MNRAS, 468, 4956 [NASA ADS] [CrossRef] [Google Scholar]
The NASA/IPAC Extragalactic Database (NED) is operated by the Jet Propulsion Laboratory, California Institute of Technology, under contract with the National Aeronautics and Space Administration (http://ned.ipac.caltech.edu).
This also provides an example of how even close pairs may suffer contamination, as from some angles the M31/Milky Way system would appear as having small projected separation such as that they would merge within 1 Gyr.
Appendix A: Additional tables
Fraction of soft X-ray selected AGN in pairs per separation and velocity difference.
Fraction of hard X-ray selected AGN in pairs per separation and velocity difference.
Fraction of radio-selected AGN in pairs and velocity difference.
Fraction of infrared selected AGN in pairs per separation and velocity difference.
All Tables
Number of galaxy pairs as a function of projected separation, velocity difference, and absolute magnitude range.
Number and fraction of galaxies in pairs detected in GalexPanSky (combination of GALEX, Pan-STARRS, and SkyMapper), eROSITA, NVSS, and SDSS DR8 MPA-JHU.
Total number of galaxy pairs where one or both galaxy pair members is actively forming stars, and active in X-rays, radio, and infrared for Boxes 1 and 2.
Fraction of soft X-ray selected AGN in pairs per separation and velocity difference.
Fraction of hard X-ray selected AGN in pairs per separation and velocity difference.
Fraction of infrared selected AGN in pairs per separation and velocity difference.
All Figures
|
Fig. 1. Distribution of all galaxies (left) and galaxies with redshift (right) on the sky. |
| In the text | |
|
Fig. 2. WISE W1 magnitude comparison of the total photometric sample (blue) and the sample with spectroscopic redshifts (red), normalised by the area under the curve. |
| In the text | |
|
Fig. 3. Spectroscopic redshift distribution of the 684 186 selected galaxies. |
| In the text | |
|
Fig. 4. MW1 versus spectroscopic redshift for galaxies in our sample. The red line represents the predicted evolution for a slowly evolving galaxy with W1 = 14.7 at z = 0. The violet and orange boxes define the two volume-limited samples we search for pairs in. We refer to the violet box (−21 < MW1 < −24 and z < 0.03) as Box 1 and to the orange box (−24 < MW1 < −27 and z < 0.10) as Box 2. |
| In the text | |
|
Fig. 5. Top: Violin plots of the distribution of (NUV − r)0 colours for galaxies in the lower mass sample (Box 1: −21 < MW1 < −24 and z < 0.03) on the left and higher mass sample (Box 2: −24 < MW1 < −27 and z < 0.10) on the right as a function of pair separation (on the X-axis) and velocity difference (red for < 500 km s−1 and blue for 500 < ΔV < 1000 km s−1). Note that we have slightly offset the two velocity samples for clarity. Galaxies below the dashed line are classified as star-forming. Bottom: Mean fraction of star-forming galaxies as a function of pair separation and velocity difference (same colour scheme as top panels) in Box 1 (left) and Box 2 (right). For the error bars see the text. |
| In the text | |
|
Fig. 6. Cumulative histogram of the wet, mixed, and dry merger fraction as a function of projected separation and velocity difference. |
| In the text | |
|
Fig. 7. Mean fractions of the wet, mixed, and dry merger as a function of projected separation and velocity difference. |
| In the text | |
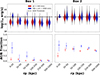 |
Fig. 8. Distribution of soft (0.2−2.3 keV) X-ray luminosities (top panels) with corresponding X-ray detected mean AGN fractions (bottom panels). Galaxies above the dashed line are classified as AGNs. The layout of this figure is as in Fig. 5. |
| In the text | |
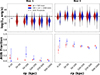 |
Fig. 9. Same as Fig. 8, but in hard (2−5 keV) X-ray band. |
| In the text | |
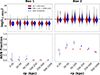 |
Fig. 10. Distribution of radio luminosity (top) and the mean fraction of radio-selected AGN (bottom). Galaxies above the dashed line are classified as AGNs. The layout of this figure is as in Fig. 5. |
| In the text | |
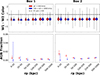 |
Fig. 11. Distribution of W1 − W2 colours (top) for our pair samples and derived mean AGN fractions (bottom). Galaxies above the dashed line are classified as AGN. The layout of this figure is as in Fig. 5. |
| In the text | |
|
Fig. 12. Left: BPT-NII diagrams for our pair samples in Box 1 (top) and Box 2 (bottom), for all analysed separations and velocity differences. Right: Fraction of galaxies classified as star-forming, composite, Seyfert 2, and LINER as a function of pair separation and velocity difference in Box 1 (top) and Box 2 (bottom). The legend in figure to identifies the samples. |
| In the text | |
|
Fig. 13. Comparison of BPT-NII diagram to our AGN samples detected in soft (0.2−2.3 keV) X-rays (left), radio (middle), and infrared (right) in Box 1 (top) and Box 2 (bottom). |
| In the text | |
|
Fig. 14. Examples of strongly interacting (top), weakly interacting (middle), and undisturbed galaxies in pairs (bottom) from PanStarrs images of our sample. |
| In the text | |
|
Fig. 15. Fraction of galaxies corresponding to the classes 1, 2, and 3 for strongly interacting, weakly interacting, and not interacting, respectively, for boxes 1 (top) and 2 (bottom) for two velocity differences (left and right plots). |
| In the text | |
|
Fig. 16. Merger class distribution for box 1 (left), and box 2 (right). Numbers 1, 2, and 3 correspond to strongly interacting, weakly interacting, and non-interacting galaxies pairs, respectively, in the closest separations (rp < 20 kpc and ΔV < 500 km/s). |
| In the text | |
|
Fig. 17. Mean fraction of star-forming galaxies in strongly interacting (class 1), weakly interacting (class 2) and undisturbed (class 3) galaxies in pairs in Box 1 (violet) and Box 2 (orange) at rp < 50 kpc separation and all velocity differences. Errors are measured as in Sect. 3.1. |
| In the text | |
|
Fig. 18. Mean AGN fractions for pairs with rp < 50 kpc separation and all velocity differences, detected in soft X-rays (top left), hard X-rays (top right), radio (bottom left), and infrared (bottom right). The colour scheme and identifications of objects are as in Fig. 17. |
| In the text | |
|
Fig. 19. Smoothed SFRs for galaxies in pairs from the Illustris-TNG simulation versus 3D separation for simulated Box 1 (top) and Box 2 (bottom). |
| In the text | |
|
Fig. 20. Bolometric luminosity of luminous AGNs (LBol > 1044 erg/s) for galaxies in pairs from the Illustris-TNG simulation versus 3D separation for simulated Box 1 (top) and Box 2 (bottom). |
| In the text | |
Current usage metrics show cumulative count of Article Views (full-text article views including HTML views, PDF and ePub downloads, according to the available data) and Abstracts Views on Vision4Press platform.
Data correspond to usage on the plateform after 2015. The current usage metrics is available 48-96 hours after online publication and is updated daily on week days.
Initial download of the metrics may take a while.