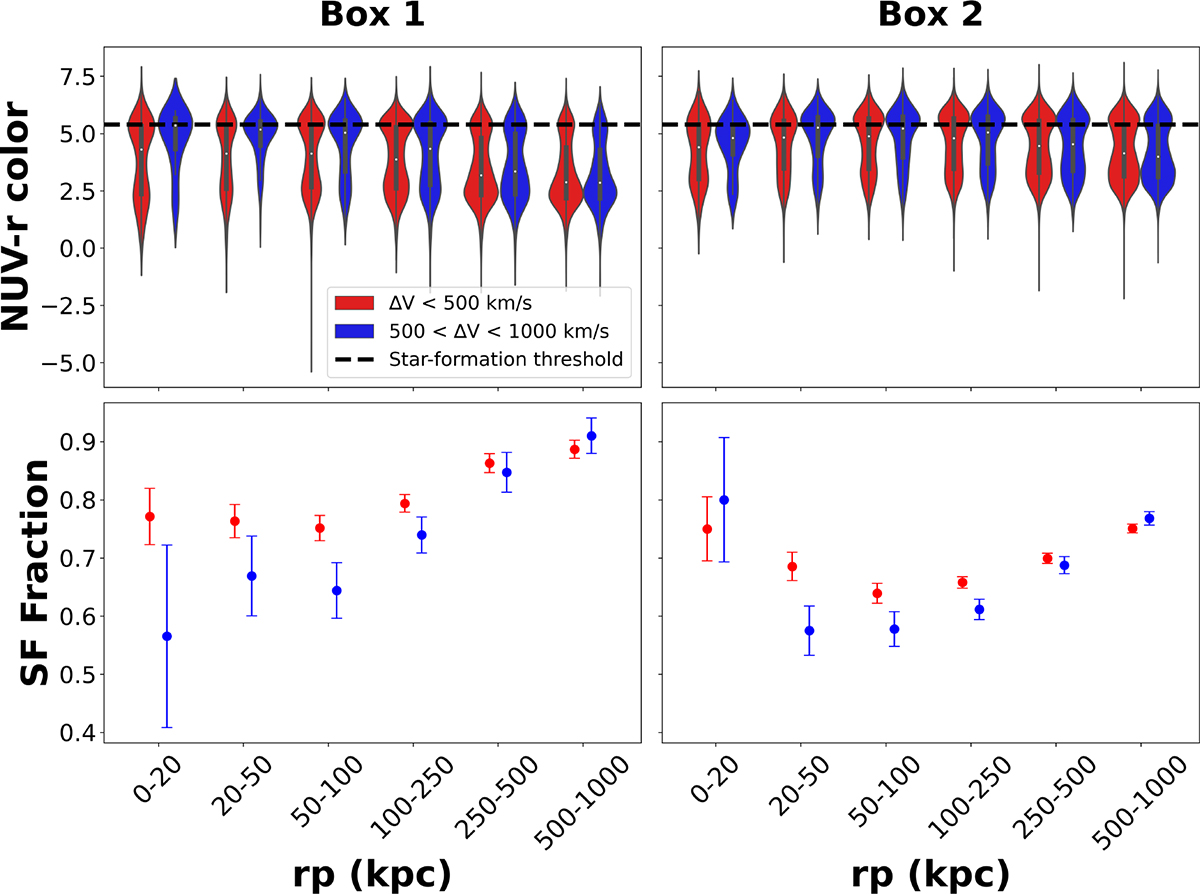
Fig. 5.
Download original image
Top: Violin plots of the distribution of (NUV − r)0 colours for galaxies in the lower mass sample (Box 1: −21 < MW1 < −24 and z < 0.03) on the left and higher mass sample (Box 2: −24 < MW1 < −27 and z < 0.10) on the right as a function of pair separation (on the X-axis) and velocity difference (red for < 500 km s−1 and blue for 500 < ΔV < 1000 km s−1). Note that we have slightly offset the two velocity samples for clarity. Galaxies below the dashed line are classified as star-forming. Bottom: Mean fraction of star-forming galaxies as a function of pair separation and velocity difference (same colour scheme as top panels) in Box 1 (left) and Box 2 (right). For the error bars see the text.
Current usage metrics show cumulative count of Article Views (full-text article views including HTML views, PDF and ePub downloads, according to the available data) and Abstracts Views on Vision4Press platform.
Data correspond to usage on the plateform after 2015. The current usage metrics is available 48-96 hours after online publication and is updated daily on week days.
Initial download of the metrics may take a while.