Fig. 10
Download original image
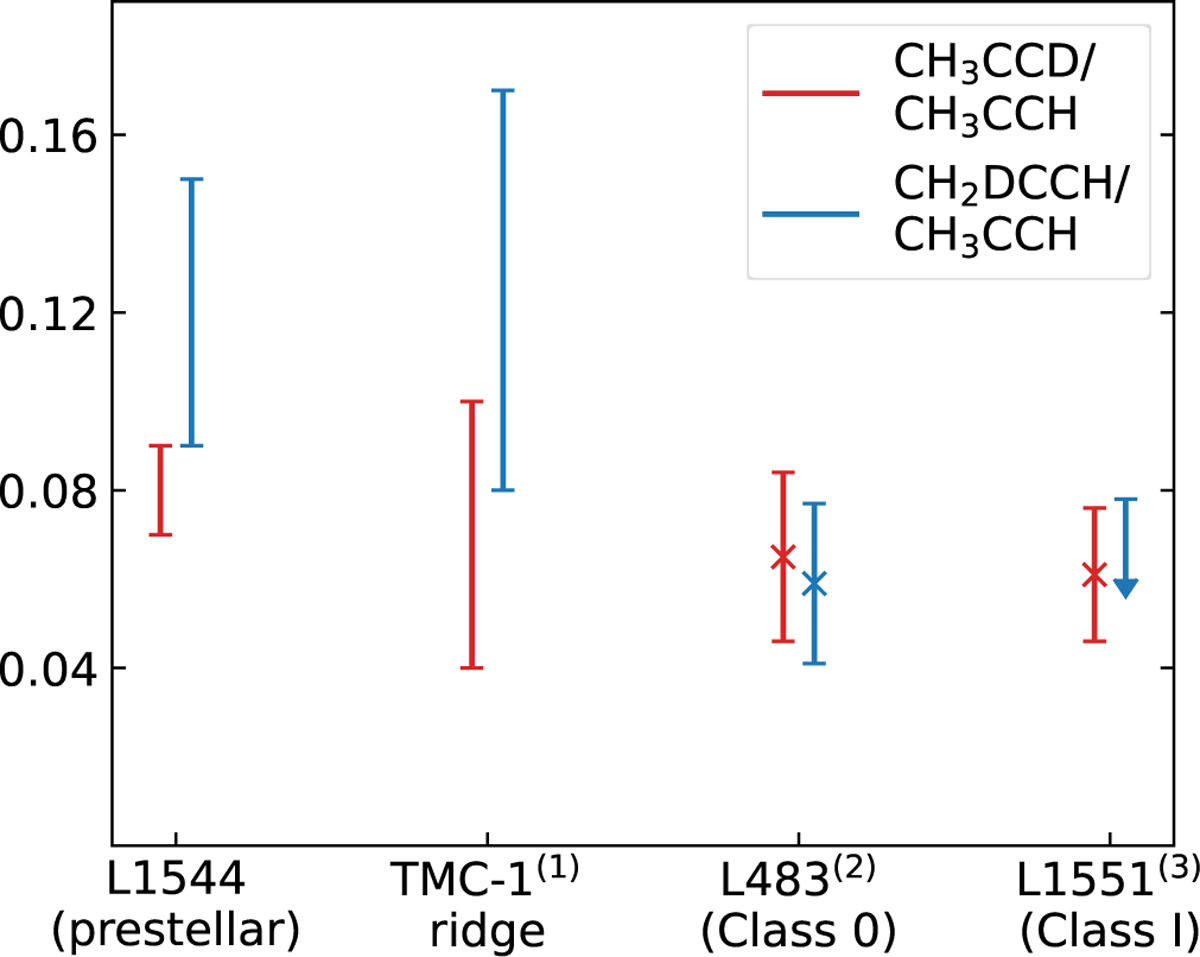
Comparison of the deuteration of CH3CCH towards different cores. For L1544 and TMC-1, the given range covers minimum to maximum values across the cores, while for L483 and L1551 single values are given including error bars or upper limits. References include: (1) Markwick et al. (2005), (2) Agúndez et al. (2019), (3) Marchand et al. (2024).
Current usage metrics show cumulative count of Article Views (full-text article views including HTML views, PDF and ePub downloads, according to the available data) and Abstracts Views on Vision4Press platform.
Data correspond to usage on the plateform after 2015. The current usage metrics is available 48-96 hours after online publication and is updated daily on week days.
Initial download of the metrics may take a while.