| Issue |
A&A
Volume 706, February 2026
|
|
|---|---|---|
| Article Number | A244 | |
| Number of page(s) | 14 | |
| Section | Interstellar and circumstellar matter | |
| DOI | https://doi.org/10.1051/0004-6361/202556755 | |
| Published online | 17 February 2026 | |
Deuteration of HC3N and CH3CCH in the pre-stellar core L1544
Max-Planck-Institute for Extraterrestrial Physics,
Giessenbachstrasse 1,
85748
Garching,
Germany
★ Corresponding author: This email address is being protected from spambots. You need JavaScript enabled to view it.
Received:
5
August
2025
Accepted:
16
December
2025
Abstract
Context. Deuterated molecules are a useful diagnostic tool to probe the evolution and the kinematics in the earliest stages of star formation. Due to the low temperatures and high densities in the centre of pre-stellar cores, the deuterium fraction is enhanced by several orders of magnitude with respect to the cosmic D/H abundance ratio.
Aims. We study the distribution of the emission and the deuteration of the two carbon chains HC3N and CH3CCH throughout the prototypical pre-stellar core L1544.
Methods. We analyse emission maps of CH3CCH, CH2DCCH, CH3CCD, HC3N, HCC13CN, and DC3N, observed towards L1544 with the IRAM 30 m single-dish radio telescope. We use non-local thermodynamic equilibrium radiative transfer calculations, combined with chemical modelling of the molecular abundances, to constrain physical parameters of the observed species. Following this, we derive the corresponding column density and deuteration maps and analyse the chemical processes influencing the different molecular distributions.
Results. We find levels of deuteration of N(DC3N)/N(HC3N) = 0.04-0.07, N(CH2DCCH)/N(CH3CCH) = 0.09-0.15, and N(CH3CCD)/N(CH3CCH) = 0.07-0.09. The deuteration of HC3N appears homogeneous across the core, with widespread D-fraction values above 0.06, tracing intermediate-density gas in the outer layers of the core, at densities less than 105 cm−3. CH3CCD is most efficiently formed in the higher-density regions towards the core centre, while the deuteration fraction of CH2DCCH traces a local density enhancement in the north-east of the core, coinciding with the CH3OH emission peak.
Conclusions. The results suggest that gas-phase reactions dominate the formation and deuteration of both HC3N and CH3CCH in L1544, with spatial variations driven by physical structure, density and external radiation. The significantly higher deuteration fraction of CH2DCCH compared to CH3CCD and a tentative gradient with higher values in the north suggest that there are different deuteration mechanisms for the two functional groups, with varying efficiency across the core. Similarities between the CH2DCCH emission and CH2DOH might indicate an additional deuteration pathway of CH3CCH on the surfaces of dust grains, as observed for H2CO.
Key words: astrochemistry / stars: formation / ISM: abundances / ISM: clouds / ISM: molecules / ISM: individual objects: L1544
© The Authors 2026
 Open Access article, published by EDP Sciences, under the terms of the Creative Commons Attribution License (https://creativecommons.org/licenses/by/4.0), which permits unrestricted use, distribution, and reproduction in any medium, provided the original work is properly cited.
This article is published in open access under the Subscribe to Open model.
Open Access funding provided by Max Planck Society.
1 Introduction
Deuterium fractionation of molecules is a powerful tool to study the early stages of star formation. Due to the combination of high densities and low temperatures in the pre-stellar phase, CO is largely depleted onto the surfaces of dust grains (see e.g. Caselli et al. 1999). As CO is the main destroyer of several ions (e.g. H+3 and its deuterated forms; Dalgarno & Lepp 1984), its depletion leads to an enhancement in their abundances. Simultaneously, the main pathway for the formation of H2D+ opens up:
 (1)
(1)
As this reaction is exothermic, the backwards reaction is suppressed at the low temperatures present in pre-stellar cores (assuming a low ortho-to-para H2 ratio; e.g. Pagani et al. 1992). The enhanced abundance of H2D+, as well as of D2H+ and D+3, then leads to an increased deuteration of other molecules, via a deuteron transfer, as predicted by models (e.g. Walmsley et al. 2004).
The evolved pre-stellar core L1544 is known for its high levels of deuteration (see e.g. Crapsi et al. 2005; Chantzos et al. 2018; Giers et al. 2023). The distribution of the deuterium fractionation across this core has been studied for a variety of molecules: HCO+, N2H+, CH3OH, H2CO, c-C3H2, and H2CS (Caselli et al. 2002a; Redaelli et al. 2019; Chacón-Tanarro et al. 2019; Giers et al. 2022; Spezzano et al. 2022). Those observations show that, for most species, the deuterium fractionation in L1544 is most efficient in the central regions of the core, indicated by the dust continuum peak, in higher-density gas layers. On the other hand, the different molecules show a wide range of deuteration levels: while H2CO and HCO+ show rather low values of around 3%, N2H+ and H2CS reach high values of up to 30%. In addition to its chemical richness, the core shows a spatial molecular segregation with characteristic emission peaks of molecules, namely c-C3H2, CH3OH, and HNCO (Spezzano et al. 2017). These seem to be the emission peaks of several other species that are chemically related to the respective molecules: carbon-chain molecules are grouped in the south on the c-C3H2 peak, O-bearing molecules such as CH3OH or SO gather in the north-east on the CH3OH peak, and HNCO in the north-west is joined by CH3CCH. The spatial differentiation between carbon chains in the south and CH3OH in the north has been explained by a non-uniform external illumination of the core (Spezzano et al. 2016). More precisely, L1544 is located at the edge of a filament in the Taurus molecular cloud, which leads to the southern part being exposed to the interstellar radiation field (ISRF), while the northern part is more protected by the molecular cloud. The ISRF drives the photochemistry in the south, enhancing the abundance of free carbon atoms in the gas phase, and subsequently the abundance of carbon chains. In the protected north, however, photochemistry is not a dominant process, and carbon is mainly locked in CO. The northern part of the core is also known to be the meeting point of two filamentary structures (e.g. see Spezzano et al. 2016; Lin et al. 2022a). Giers et al. (2025) suggest that inflowing, fresh material actually enhances the abundances of chemically young species in this area, causing the emission peak of CH3CCH in the north-west of the core.
This work focuses on the emission and the distribution of the two carbon chains HC3N and CH3CCH and their singly deuterated isotopologues. In L1544, the two molecules show a spatial differentiation (see Fig. 1), where the emission of HC3N follows other carbon chains and peaks in the south of the core, while CH3CCH peaks in the north-west on the HNCO peak. Therefore, the observations of HC3N, CH3CCH, and isotopologues offer complementary insights into the complex chemical structure of the prototypical pre-stellar core L1544. In addition, this dataset gives the opportunity to study the deuteration of larger molecules in L1544 in more detail, providing a deeper understanding of the chemical processes that dominate in pre-stellar cores and shape the observed chemical structures. In addition, the study of deuteration can help to better understand the formation pathways of the molecules and, eventually, put constrains on chemical models.
Cyanoacetylene, HC3N, is the smallest molecule from the family of cyanopolyynes, which are possible precursors of prebiotic molecules (see e.g. Shingledecker et al. 2021). After its first detection in space by Turner (1971), HC3N has since been detected in various interstellar environments (see e.g. Morris et al. 1976; Walmsley et al. 1980; Chapillon et al. 2012; Spezzano et al. 2017). The deuterated counterpart, DC3N, was first detected by Langer et al. (1980) towards the low-mass dark cloud TMC-1, and by Howe et al. (1994) towards several other dark cores. Methylacetylene, CH3CCH, is a large carbon chain, and a proposed precursor in the formation of polycyclic aromatic hydrocarbons (PAHs) (Parker & Kaiser 2017). It contains a methyl group with three equivalent H atoms and one H atom in the terminal CCH group, which makes the study of its deuteration very useful for understanding the molecule’s formation pathways. In the interstellar medium (ISM), CH3CCH was first detected by Buhl & Snyder (1973), followed by detections in various other environments (van Dishoeck et al. 1995; Fontani et al. 2002; Vastel et al. 2014; Gratier et al. 2016; Spezzano et al. 2017; Agúndez et al. 2019; Lin et al. 2022b). The singly deuterated isotopologues CH2DCCH and CH3CCD were first detected towards the cold dark cloud TMC-1 (Gerin et al. 1992; Markwick et al. 2005). The detection of the doubly deuterated forms CHD2CCH and CH2DCCD was reported by Agúndez et al. (2021).
Both HC3N and CH3CCH are believed to primarily form in the gas phase. The main formation pathways for CH3CCH are thought to involve ion-molecule reactions, neutral-neutral reactions, and dissociative recombination of larger hydrocarbons (Schiff & Bohme 1979; Turner et al. 1999; Calcutt et al. 2019; Giers et al. 2025), while for HC3N, potential formation routes are via HCN, CN, or HNC (Iraqi et al. 1990; Sims et al. 1993; Fukuzawa & Osamura 1997; see Hily-Blant et al. 2018 for an overview). Not much is known about the deuteration process of either species, but there is evidence that it occurs mainly in the gas phase. According to Rivilla et al. (2020), DC3N most likely forms via ion-molecule reactions, for example of HC3N directly reacting with H2D+, whereas the deuteration of CH3CCH is believed to occur via the dissociative recombination of C3H6D+ and C3H5D+ (Agúndez et al. 2021).
In this work, we present the emission maps of CH2DCCH, CH3CCD, and DC3N, and their non-deuterated isotopologues CH3CCH, HC3N, and HCC13CN, observed towards the pre-stellar core L1544. We report the observations and detected lines in Sect. 2. In Sect. 3.2, we model spectral lines extracted towards the dust peak of the source with non-local thermodynamic equilibrium (non-LTE) radiative transfer calculations to constrain physical parameters of the molecular emission. Following this, we derive the corresponding column density and deuterium fraction maps of the different species in Sect. 3.3, assuming LTE conditions. In Sect. 4, we discuss the deuterium fractionation of HC3N and CH3CCH in L1544 and the implications for the understanding of the ongoing chemical processes. Section 5 concludes the article.
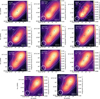 |
Fig. 1 Integrated intensity maps of the observed transitions. The grey solid line contours indicate the 30%, 70%, and 90% level of the peak integrated intensity. The dashed line contours represent 30%, 50%, and 90% of the H2 column density peak derived from Herschel maps (Spezzano et al. 2016). The markers in blue represent the dust peak (triangle) and the molecular emission peaks of CH3OH (diamond), CH3CCH (star), and c-C3H2 (plus sign), where emission spectra (shown in Fig. 2) are extracted within a circular aperture with a diameter corresponding to the telescope beam. The white circle in the bottom-left corner indicates the beam size of the IRAM 30 m telescope (31″). |
Spectroscopic parameters of the observed lines.
2 Data
The data presented in this work were taken with the IRAM 30 m single-dish radio telescope on Pico Veleta in the Sierra Nevada, Spain. The observations were carried out between October 2013 and June 2022 (PIs: Silvia Spezzano, Katharina Giers). The data for HC3N, HCC13CN, CH3CCH, and CH2DCCH have also been used in Spezzano et al. (2017) and Giers et al. (2025). The on-the-fly (OTF) maps were observed in position switching mode, using the EMIR E090 receiver and the Fourier transform spectrometer (FTS) backend with a spectral resolution of 50 kHz. The observed 2.5′ × 2.5′ OTF maps were centred on the source dust emission peak (α2000 = 05h04m17S21, δ2000 = +25°10′42″.8, Ward-Thompson et al. 1999). The observed transitions are summarised in Table 1.
Data processing was done using the GILDAS software (Pety 2005) and the python packages pandas (Wes McKinney 2010) and spectral-cube (Ginsburg et al. 2019). All emission maps were gridded to a pixel size of 8″ with the CLASS software in the GILDAS packages. This corresponds to one-third to one-quarter of the actual beam size, depending on the frequency. To create a uniform dataset, we additionally resampled the data to a spectral resolution of 0.18kms−1, corresponding to the resolution of the lowest frequency observation (84.4 GHz). The antenna temperature T*A was converted to the main beam temperature Tmb using the relation Tmb = Feff/Beff ∙ T*A. The corresponding values for the 30 m forward (Feff) and main-beam efficiencies (Beff) are given in Table 1. Figure 1 shows the integrated intensity maps of the observed transitions, computed by integrating over a velocity range of 0.7 km s−1 around each line. For CH3CCH, only the K=0 and K=1 transitions were considered, due to the low signal-to-noise ratio of the K=2 and K=3 transitions. To enable comparison between the molecules in our following analysis, all maps were convolved to an angular resolution of 31″, which corresponds to the half-power beam width (HPBW) of the largest observed beam.
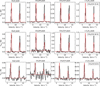 |
Fig. 2 Observed spectra (black) of the CH3CCH (top) and the CH3CCD (bottom) K=0 and K=1 transitions extracted towards the three molecular peaks in L1544 and the dust peak, using a circular aperture with diameter 31″. The extraction locations are indicated in Fig. 1. Shown in red are synthetic spectra produced with the LTE model generator of the python package pyspeckit. The input column densities are [4, 2, 5, 8](±0.3) × 1013 cm−2 for CH3CCH and [3, 1, 4, 5](±0.3) × 1012 cm−2 for CH3CCD at the dust peak, CH3OH peak, CH3CCH peak, and c-C3H2 peak, respectively. The input excitation temperature is set to a constant value of 10 K for both molecules. |
3 Analysis
3.1 Spectral line emission
The goal of this work is to study the deuterium fraction of HC3N and CH3CCH across the source. To do so, a reliable estimation of the molecular column densities is crucial.
For CH3CCH and CH3CCD, we observe more than one transition. Figure 2 presents spectra of the CH3CCH (5-4) and (6-5), and the CH3CCD (6-5) K=0 and K=1 transitions, extracted towards the three molecular peaks and the dust peak in L1544 by using a circular aperture with a diameter corresponding to the telescope beam size, 31″. The extraction locations and beam size are indicated in Fig. 1. The observations show that the line intensity ratio between the K=0 and K=1 transitions varies across the core, for CH3CCH between 1:1 and 1:1.2, and for CH3CCD between 1:1 and 1:1.4. In a first approach, we assumed local thermodynamic equilibrium (LTE) and modelled the spectra using lte_molecule and generate_model from the python package pyspeckit. We applied a constant excitation temperature of 10 K, which is consistent with previous measurements of CH3CCH in this source (e.g. Vastel et al. 2014), and adjusted the column densities to fit the intensity of the K=0 lines. The resulting modelled spectra are shown in red in Fig. 2. For both CH3CCH and CH3CCD, the line ratio between K=0 and K=1 is estimated to be around 2:1. This is not visible in the observations, which vary between 1:1 and 1:1.4. However, the emission lines are in the optically thin regime, with τmax(Tex = 10 K) ≈ 0.27. Therefore, self-absorption is unlikely to be the cause of the line ratios. Following this, there must be another effect influencing the line intensities, and given the relatively high critical density of CH3CCH (ncrit ≈ 105 cm−3) compared to the densities across the core (104−107 cm−3), it is likely that non-LTE effects play a role.
Therefore, a non-LTE approach would be necessary to test whether non-LTE effects might cause the observed intensity ratios, and to constrain the molecular column densities. A full non-LTE analysis lies beyond the scope of this paper, because the required 3D model of the temperature and density structure of the core does not exist. Instead, we focus on the analysis of the emission lines extracted at the dust peak of L1544. In the following, we model the observed spectra with non-LTE radiative transfer in Sect. 3.2, before we analyse the column densities and deuterium fractions in LTE in Sect. 3.3, using the non-LTE results to constrain the physical parameters of the emission.
3.2 Non-LTE modelling at the dust peak
In this section, we simulate the observed molecular spectra towards the dust peak of L1544 with the non-LTE radiative transfer code Line Transfer with OpenCL (LOC, Juvela 2020). We assumed a 1D model that considers spherical symmetry of the physical properties and chemical abundances. The physical structures are characterised by volume density, kinetic temperature, and infall velocity. For this, we adopted the physical model of L1544 presented in Keto et al. (2015) (hereafter Keto-Caselli model), shown in Fig. 3. It describes an unstable quasi-equilibrium Bonnor-Ebert sphere (Ebert 1955; Bonnor 1956) with a peak central H2 volume density of n0 ≈ 107 cm−3 and a central gas temperature of 6 K. To approximate the molecular abundances, we used profiles of the fractional abundance with respect to H2 molecules, hereafter referred to as ’abundance profiles’. We applied both constant abundance profiles, as well as radial abundance profiles predicted by the state-of-the-art gas-grain chemical model pyRate (Sipilä et al. 2019). For the constant abundance profiles, we set the abundance to zero within a radius of 1800 au, as L1544 is known to exhibit a freeze-out of 99.99% of species heavier than Helium in this central region (Caselli et al. 2022). In pyRate, we applied the two-phase model of the code, where the gas-phase chemistry and the entire ice chemistry on the grains are active. We used the same initial abundances and chemical networks as presented in Sipilä et al. (2019) and the same standard values for various model parameters as used in Giers et al. (2022). In the chemical simulation, the Keto-Caselli model is used as a static physical model for L1544, assuming an external visual extinction of AV = 2 mag to account for the molecular cloud where the core is embedded. The resulting abundance profiles were extracted at various evolutionary times across the chemical simulation.
For the line simulations of HC3N and CH3CCH, the latest collision rate coefficients are available on the Leiden Atomic and Molecular Database (LAMDA, Schöier et al. 2005; Faure et al. 2016; Ben Khalifa et al. 2024). In the case of HCC13CN, we used the rates of HC3N and scaled them with the corresponding reduced mass of the isotopologue. For the deuterated isotopologues of HC3N and CH3CCH, a scaling of the rates was not possible, as the different nuclear spins induce different hyperfine structures. Therefore, we could not apply the non-LTE modelling to these species.
The abundance profiles that provide the best-fit solutions for HC3N and CH3CCH are shown in Fig. 4. A comparison between the modelled spectra and the observed lines is shown in Fig. 5 for HC3N, and HCC13CN, and in Fig. 6 for CH3CCH. The observed spectra, shown in black, are extracted at the dust peak of the core, averaged over an area corresponding to the telescope beam size (31″ ). To enable a comparison, the synthetic spectra were convolved with this observational beam for each transition frequency. The molecular column densities at the dust peak derived by LOC are given in Table 2.
The spectrum of HCC13CN can be reproduced both with a constant abundance and a radial abundance profile from the chemical modelling. With a depletion radius of 1800 au, a constant abundance of 2.5 ∙ 10−11 fits best. When applying the abundance profiles from pyRate, the observed lines are reproduced within a factor of 2 with profiles extracted at early time steps of the chemical simulation (t1 = 105 yr, t2 = 1.3 ∙ 105 yr).
The brightness of the HC3N spectral line can be reproduced with modelling at a constant fractional abundance of 1.5 ∙ 10−9 with a depletion radius of 1800 au, and, similar to HCC13CN, at early time steps within a factor of 2 in intensity (t1 = 105 yr, t2 = 1.3 ∙ 105 yr). However, the modelling fails to recreate the slightly asymmetric, redshifted shape of the line profile. This asymmetric shape is likely caused by the velocity gradient across the core with higher velocities in the south, where HC3N peaks (Bianchi et al. 2023). Therefore, more material emits at slightly higher velocities, compared to the systemic velocity of the core in the centre, causing a redshifted asymmetry. The column densities of HC3N and HCC13CN derived by the best-fit models result in an isotopic ratio of 12C/13C=60 ± 20, which is in agreement with the value for the local interstellar medium, 12C/13C=68 (Milam et al. 2005).
All observed transitions of CH3CCH can be reproduced with a constant abundance profile of 1.5 ∙ 10−9 and a depletion radius of 1800 au. As the non-LTE modelling is able to reproduce the observed line ratios between the K=0 and K=1 transitions correctly, we are able to use the central column density of CH3CCH derived by LOC in the analysis below. However, the emission lines cannot be reproduced with any of the abundance profiles derived from chemical modelling. In fact, the radially varying abundance profiles largely underestimate the abundance of CH3CCH, by roughly three orders of magnitude. Figure 6 illustrates that it is necessary to multiply the abundance profile by a factor of 700 to reproduce the observed line intensities. This issue was already noted in previous research, where various chemical models failed to predict observed molecular abundances of CH3CCH. The formation pathways of CH3CCH have been widely studied, with formation proposed via ion-molecule reactions, neutral-neutral reactions, and dissociative recombination in the gas phase (Schiff & Bohme 1979; Turner et al. 1999; Calcutt et al. 2019), and hydrogenation of C3 on grain surfaces (Hickson et al. 2016; Guzmán et al. 2018). However, models demonstrated that these gas-phase and grain-surface formation pathways are not sufficient to reproduce CH3CCH abundances in cold molecular clouds (see e.g. Öberg et al. 2013; Hickson et al. 2016). Hence, it is necessary to further investigate potential grain surface reactions of CH3CCH or alternative gas phase pathways at low temperatures to improve the chemical networks and ultimately the model predictions.
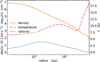 |
Fig. 3 Profiles of the gas temperature (red), H2 number density (orange, in logarithmic scale), and infall velocity (blue, in units of 0.1 km s−1) for the Keto-Caselli model of L1544 (Keto et al. 2015). The velocity in the model is negative but is shown here as positive to improve readability. |
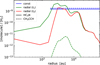 |
Fig. 4 Fractional abundance profiles of HC3N (solid) and CH3CCH (dashed) of the best-fit results produced with LOC. For HCC13CN, the radial abundance profiles derived with chemical modelling (green, red) correspond to the profiles of the main isotopologue, scaled down by the isotopic ratio, 68. |
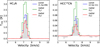 |
Fig. 5 Comparison of the observed spectra (grey) of HC3N, and HCC13CN, extracted towards the dust peak of L1544, to the synthetic spectra (red, blue, green) produced with LOC. For the constant abundances, a depletion radius of 1800 au is assumed. |
3.3 Column density and deuteration maps
A detailed non-LTE analysis is only possible towards the dust peak of L1544. To study the distribution of the molecular emission across the core, we used the LTE assumptions to compute the column density maps, and used the non-LTE results as a constraint.
3.3.1 Column density
To derive the molecular column densities, we assumed optically thin emission, following the derivation presented in Mangum & Shirley (2015). Furthermore, we applied the approximation of a constant excitation temperature across the core (see Caselli et al. 2002b; Redaelli et al. 2019). This results in a column density of
![Mathematical equation: N=\frac{8\pi\nu^3}{c^3}\frac{Q_\mathrm{rot}(T_\mathrm{ex})}{g_uA_\mathrm{ul}}\left[J_\nu(T_\mathrm{ex})-J_\nu(T_\mathrm{bg})\right]^{-1}\frac{\mathrm{e}^{\frac{E_u}{kT_\mathrm{ex}}}}{\mathrm{e}^{\frac{h\nu}{kT_\mathrm{ex}}}-1}\int T_\mathrm{mb}\mathrm{dv}\;,](/articles/aa/full_html/2026/02/aa56755-25/aa56755-25-eq3.png) (2)
(2)
where Qrot(Tex) is the partition function of the molecule at an excitation temperature Tex, gu and Eu respectively represent the degeneracy and energy of the upper level of the transition, Aul is the Einstein coefficient for spontaneous emission, Tbg = 2.73 K is the temperature of the cosmic microwave background, J(T) is the Rayleigh-Jeans equivalent temperature, and Tmb is the main-beam temperature. The corresponding parameters for each transition used in the derivation of the column density are listed in Table 1.
The observed range of Eu only covers about 5 K for the molecules where multiple transitions were observed (CH3CCH, CH3CCD, DC3N). Therefore, an excitation analysis to derive the excitation temperatures pixel by pixel is not feasible. Instead, we followed Redaelli et al. (2019) to determine the excitation temperatures for CH3CCH and HCC13CN and fixed the column density at the dust peak to the value derived from a constant molecular abundance profile with the non-LTE modelling in Sect. 3.2 (see Table 2). From this, we derived the corresponding excitation temperatures in the LTE regime, using Eq. (2), and applied this value across the whole core to derive the column density maps.
Therefore, we set an excitation temperature of 7 K for HCC13CN and 10K for CH3CCH, which is in agreement with values used in previous studies (see e.g. Howe et al. 1994; Markwick et al. 2005; Vastel et al. 2014; Hily-Blant et al. 2018; Agúndez et al. 2019; Bianchi et al. 2023). As shown in the previous section, non-LTE effects are responsible for the line intensity ratio observed for CH3CCH K=0 and K=1 towards the dust peak. We decided to use the K=0 lines to derive the column density map for CH3CCH, because the column density value of these lines at the dust peak matches with an excitation temperature that is reasonable for L1544. For the K=1 lines, however, we would have to use an excitation temperature around 60 K, which is significantly higher than what was routinely observed in this core. An example of the CH3CCH column density and deuteration maps derived from the K=1 transitions is given in Appendix A.2. For the further analysis, we focus on the K=0 line of the (5-4) transition instead of the (6-5) transition because of its higher signal-to-noise ratio.
As the non-LTE approach was not possible for the deuterated isotopologues due to missing collision rate coefficients, we adopted the respective excitation temperature of the main species. To derive the column density of CH3CCD, we used the K=0 transition, as for CH3CCH. The effect of the excitation temperature on the derived column density ratios was found to be weak, with a change of a few percent upon a variation of ± 1 K (as stated in Spezzano et al. 2013).
To account for the varying optical depth of the lines across the core, we corrected the column density by deriving the optical depth at each pixel individually using the respective excitation temperature, then multiplying the maps by (see e.g. Goldsmith & Langer 1999)
 (3)
(3)
This results in a correction factor of up to 1.1 in the southern part of the core.
The transitions used to derive the column density for each species are marked with an asterisk in Table 1. The corresponding column density maps are presented in Fig. 7. In the following, we discuss the results for each species individually.
HC3N: The emission of HC3N is moderately thick in this core, with optical depths of up to 0.9. Therefore, we approximated the column density of HC3N with the emission of the 13C isotopologue, multiplied by the isotopic ratio for the local interstellar medium, 12C/13C = 68. Given the results of the non-LTE modelling, 12C/13C = 60 ± 20 at the dust peak, this is a reasonable assumption. The resulting column density map peaks in the south-east of the core (see Fig. 7), on the carbon-chain peak caused by non-uniform external illumination (see Spezzano et al. 2017), with a maximum value of 6.3(5) × 1013 cm−2, where the number in parenthesis indicates the uncertainty of the last digit. This is consistent with previous measurements towards L1544 (2-8 × 1013 cm−2, Hily-Blant et al. 2018; 7(2) × 1013 cm−2, Howe et al. 1994). Additionally, the column density of HC3N shows a local peak towards the north-west of the core (where CH3CCH peaks) with a maximum of 5.4(5) × 1013 cm−2, and a dip in the core centre indicating the molecular freeze-out zone. The deuterated isotopologue is distributed similarly to the 13C-isotopologue, peaking in the south-east (3.5(2) × 1012 cm−2), and with a local peak in the north-west (3.1(2) × 1012 cm−2). These column density levels are consistent with previous measurements towards L1544 (e.g. Howe et al. 1994).
CH3CCH: In contrast to HC3N, the emission of CH3CCH peaks in the north-west of the core, with a maximum value of 5.85(6) × 1013 cm−2. Here, it is possible that ongoing accretion of material from cloud to core leads to chemically fresh gas and a replenishment of CH3CCH (see Giers et al. 2025). A weaker, secondary peak is visible in the south-east of the core, on the carbon-chain peak, with values of 5.43(6) × 1013 cm−2. The column density of CH2DCCH is distributed similarly to the main isotopologue, with a peak column density of 2.0(2) × 1013 cm−2 and a southern peak at 1.7(2) × 1013 cm−2, which is equal to the northern peak within error bars. The column density of CH3CCD, on the other hand, peaks closer to the core centre (4.1(4) × 1012 cm−2), with a second, equally strong peak (4.0(5) × 1012 cm−2) in the southern part of the core.
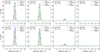 |
Fig. 6 Comparison of the observed spectra (grey) of CH3CCH, extracted towards the dust peak of L1544, to the synthetic spectra (red, blue, green) produced with LOC. For the constant abundances, a depletion radius of 1800 au is assumed. |
 |
Fig. 7 Column density maps of HC3N and CH3CCH and their deuterated isotopologues. The column densities are derived with a constant excitation temperature of 7 K and 10 K for HC3N and CH3CCH and their isotopologues, respectively, and are corrected for optical depth. To derive the column density of HC3N, we used the emission of HCC13CN, assuming a constant 12C/13C=68 (Milam et al. 2005). The solid line contours indicate the 3σ level of the integrated intensity. The dashed line contours represent 30%, 50%, and 90% of the H2 column density peak derived from Herschel maps (Spezzano et al. 2016). The circle in the bottom-left corner indicates the beam size of the IRAM 30 m telescope (31″). The markers in grey represent the dust peak (triangle) and the molecular emission peaks of CH3OH (diamond), CH3CCH (star), and c-C3H2 (plus sign). |
3.3.2 Deuterium fraction
The deuterium fractions were derived pixel by pixel by dividing the column density maps of the deuterated isotopologues by the column density map of the corresponding main species. For the ratio of N(CH2DCCH)/N(CH3CCH), we accounted for the degeneracy of the D atom by dividing the ratio by a factor of 3. The resulting deuteration maps are presented in Fig. 8 for HC3N, and Fig. 9 for CH3CCH. In the following, we describe the results for each molecule individually:
DC3N/HC3N: The deuterium fraction map shows moderate levels of deuteration, in the range of 0.04-0.07. The distribution is rather homogeneous across the whole core. The highest values (0.06-0.07) are widespread, and located mostly north and south-east of the core centre.
CH3CCD/CH3CCH: The map shows that the deuterium fraction is, within the uncertainties (see Fig. A.1), distributed rather homogeneously across the core, with values between 0.07 and 0.09. A trend of higher values (≥0.09) is visible towards the centre and the north-east of the core. The high D/H values at the edges of the map should be treated with caution since they have large uncertainties of around 30%.
CH2DCCH/CH3CCH: This deuteration map shows a larger extension across the core than the map of CH3CCD/CH3CCH, due to a better signal-to-noise ratio. Additionally, the map exhibits a significantly higher deuterium fraction than CH3CCD/CH3CCH, with values between 0.09 and 0.15. In contrast to CH3 CCD/CH3CCH, the distribution of CH2DCCH/CH3 CCH exhibits a clear peak away from the centre towards the north-east of the core, with a peak value of 0.15(3).
CH2DCCH/CH3CCD: The ratio map between the two deuterated isotopologues shows that CH2DCCH is more abundant than CH3 CCD. The distribution is roughly homogeneous across the core, with a slight trend of higher values towards the north (5.3 ± 0.9) compared to the south (4.1 ± 0.9). The statistically expected ratio of CH2DCCH/CH3CCD is 3, which results from the statistical considerations for the insertion of deuterium in the CH3 group and the CCH group. We derive an average ratio of 4.5(8), which is a 50% increase with respect to the statistical value.
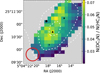 |
Fig. 8 Deuteration map of HC3N. Only pixels above the 3σ level of the respective integrated intensities are plotted. The dashed line contours represent 30%, 50%, and 90% of the H2 column density peak derived from Herschel maps (Spezzano et al. 2016). The circle in the bottomleft corner indicates the beam size of the IRAM 30m telescope (31″). The markers in black represent the dust peak (triangle) and the molecular emission peaks of CH3OH (diamond), CH3CCH (star), and c-C3H2 (plus sign). The corresponding D/H error map is shown in Fig. A.1. |
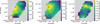 |
Fig. 9 Deuteration maps of CH3CCH. Only pixels above the 3σ level of the respective integrated intensities are plotted. The dashed line contours represent 30%, 50%, and 90% of the H2 column density peak derived from Herschel maps (Spezzano et al. 2016). The circle in the bottom-left corner indicates the beam size of the IRAM 30 m telescope (31″). The markers in black represent the dust peak (triangle) and the molecular emission peaks of CH3OH (diamond), CH3CCH (star), and c-C3H2 (plus sign). The corresponding D/H error maps are shown in Fig. A.1. |
4 Discussion
4.1 HC3N
The column density maps presented in Fig. 7 show that the two carbon chains HC3N and CH3CCH and their deuterated counterparts exhibit different morphologies across the core. The emission of both HC3N and its deuterated isotopologue peak at the carbon-chain peak in the south of the core. The resulting deuterium fraction map, however, exhibits a rather homogeneous distribution across the core with moderate levels of deuteration (0.05–0.07). This is in agreement with previous measurements in L1544 (Howe et al. 1994). Results for the deuterium fraction of HC3N show roughly similar values in other cores: 0.03–0.11 in the dark cloud TMC-1 (Howe et al. 1994), 0.03(1) in the cold envelope of the Class 0 protostar L1527 (Sakai et al. 2009), and 0.03(1) in the dense core L483 (Turner 2001; Sakai et al. 2009; Agúndez et al. 2019).
The moderate deuteration levels and extended morphology of the deuteration map in L1544 indicate that HC3N and DC3N do not trace the high-density regions in the core centre (e.g. N2H+ and N2D+), but rather a less dense layer of gas in an outer shell of the core (in agreement with Rivilla et al. 2020), at densities of less than 105 cm−3 (see Fig. 4). In the less dense gas, the process of deuteration is less efficient due to a lower abundance of H2D+. Therefore, the moderate deuterium fraction suggests that DC3N is most likely formed in the gas phase, presumably via ion-molecule reactions, as discussed in Rivilla et al. (2020).
The assumption that HC3N and DC3N trace intermediatedensity gas in L1544 is supported by the abundance profiles used to reproduce the emission lines of HC3N and HCC13CN (see Fig. 4). These abundance profiles peak at a volume density of roughly 105 cm−3, which is significantly lower than the critical densities of both transitions (ncrit(HC3N) ≈ 107 cm−3, ncrit(HCC13CN) ≈ 106 cm−3). This was also observed by Bianchi et al. (2023), who state that the carbon-chain abundance is enhanced towards the external part of the core, where the material is more exposed to the ISRF (see also Spezzano et al. 2016). This becomes visible in the slightly asymmetric line shapes of HC3N and HCC13CN at the dust peak and the c-C3H2 peak (see Fig. B.1). This asymmetry is caused by the velocity gradient across L1544, which leads to higher velocities at the carbon-chain peak in the southern part (see Spezzano et al. 2016; Spezzano et al. 2017; Giers et al. 2025), creating redshifted, asymmetric line profiles for carbon-chain molecules, as most of their emission originates in this part. This effect cannot be reproduced with non-LTE modelling, because the physical structure assumes the core to be spherically symmetric and does not account for asymmetric velocity variations across the core.
4.2 CH3CCH
The observed ratios between the peak intensities of the K=0 and K=1 emission lines of CH3CCH and CH3CCD - both for the (5-4) and the (6-5) transitions - cannot be reproduced assuming LTE conditions but instead require a non-LTE treatment. Compared with the observations, the LTE model either overestimates the K=0 line or underestimates the K=1 line. Low densities in the layers traced by CH3CCH could cause non-LTE conditions, leading to a sub-thermal excitation of the transitions and subsequently generating the emission lines different from the expected LTE profile. Figure 2 shows that the line intensity ratios also vary across the core. However, the ratio of the integrated intensity maps of the (50−40) over the (51−41) transition is roughly constant across the core, with an average value of 1.05(2). Therefore, the effect of the line variations on the derived column density of CH3CCH and the deuteration maps should be within the error bars constrained by the derivation. The emission of CH3CCH peaks in the north-west of L1544, away from the carbon-chain peak in the south-east. The northern part of this core is shaped by the interaction of two filaments (e.g. Spezzano et al. 2016). These structures are believed to transport fresh, chemically young gas into the north and north-west of the core (Giers et al. 2025). This replenishes the abundance of CH3CCH and causes the molecular peak away from the carbon-chain peak in the south.
In contrast to CH3CCH, the emission of the deuterated isotopologue CH3CCD exhibits two strong peaks, one located in the southern part of the core at the carbon-chain peak, similar to the emission of DC3N. The second is close to the dust peak, shifted slightly to the north-west, and coincides with the emission peak of HDCO, singly deuterated H2CO (see Chacón-Tanarro et al. 2019). The resulting deuterium fraction map of CH3CCD peaks close to the core centre, slightly offset towards the CH3OH emission peak in the north-east with maximum values of 0.09(2). A similar behaviour was also observed for the carbon chain c-C3H2, where the deuteration is most efficient towards the dust peak in the centre of the core (Giers et al. 2022). This, together with the similarities to DC3N and HDCO, supports the theory that the CCH group of CH3CCH is deuterated in the gas phase, as stated in Markwick et al. (2005).
The distribution of CH2DCCH across L1544 mostly follows the emission of the main species. In the resulting deuteration map, however, the highest values (0.15(3)) are concentrated off-centre and towards the north-east of the core, where CH3 OH peaks (see e.g. Spezzano et al. 2016). In this region, CH3OH traces a local density enhancement (Lin et al. 2022a), a clumpy substructure that introduces a deviation from the Bonnor-Ebert density profile used to describe the core structure in Keto et al. (2015). In fact, the CH3 OH peak seems to be the meeting point of the two larger-scale filamentary structures where L1544 is embedded. This intersection of filaments is believed to induce slow collision shocks, causing the local density enhancement (Lin et al. 2022a). The peak of the CH2 DCCH deuteration map overlaps with this higher-density region. The higher density in this area leads to a more efficient freeze-out of molecules, including CO, which drives more deuteration in the gas phase (e.g. Caselli et al. 2002b). In addition, the enhanced freeze-out onto grains leads to higher reactivity and hence drives the reactive desorption of species from dust grains (e.g. Vasyunin et al. 2017). The combination of these effects likely leads to the higher deuteration efficiency observed for CH2 DCCH.
In general, CH2DCCH shows higher levels of deuteration (0.09-0.15) than CH3CCD (0.07-0.09). Figure 10 compares the observed deuteration values of the two isotopologues to those in other cores. Notably, the dark cloud TMC-1 shows similar behaviour to L1544: along the TMC-1 ridge, CH3CCD/CH3CCH shows higher values than CH2DCCH/CH3CCH (Markwick et al. 2005). In contrast, the protostellar cores L483 and L1551 show similar levels of deuteration in both isotopologues (Agúndez et al. 2019; Marchand et al. 2024).
A comparison between the two deuterated isotopologues (see right-hand plot in Fig. 9) shows that in L1544 CH2DCCH is 4.1-5.5 times more abundant than CH3CCD. In contrast, Markwick et al. (2005) reported a CH2DCCH/CH3 CCD ratio ranging between 1.2-2 along the TMC-1 ridge, which is significantly lower than the statistical value of 3. The authors attribute these lower values to decreased abundances of H2D+ due to ambipolar diffusion, leading to a lower deuterium fractionation. On the other hand, Agúndez et al. (2019) report a ratio of 3 ± 1 for CH2DCCH/CH3CCD in the dense core L483. The authors are able to reproduce the observed abundances of CH3CCH and its singly and doubly deuterated isotopologues in this core with a pure gas-phase chemical model (Agúndez et al. 2021). From this, they conclude that the formation and deuteration of CH3 CCH in L483 occurs in the gas-phase rather than on grain surfaces. They propose that deuterated CH3 CCH is formed by the dissociative recombination of C3H5D+ and C3H6D+. However, in L1544 the average CH2DCCH/CH3CCD ratio observed is 4.5(8), which is significantly higher than the expected statistical value of 3, showing that CH2DCCH has a higher deuteration efficiency than CH3CCD in this core. Therefore, additional processes must exist that enhance deuteration of the CH3CCH methyl group, or decrease the abundance of CH3CCD. Together with the tentative gradient of CH2DCCH/CH3CCD across the core, this suggests different deuteration mechanisms for the two functional groups with varying efficiency across the core.
A comparison of the emission of deuterated CH3CCH and deuterated methanol shows interesting similarities: both CH2 DCCH and CH2DOH peak in the northern part of L1544, close to the dust peak (see Chacón-Tanarro et al. 2019), and show significantly greater deuteration in the methyl group than in the CCH or the OH group (CH2DOH/CH3OD ≥10, Bizzocchi et al. 2014). The root of this might be a common formation path for CH2DCCH and CH2DOH on the surfaces of dust grains, which was not considered in the pure gas-phase model used in Agúndez et al. (2021). The similarities between the CH3 CCD and HDCO emission provides another hint, as H2 CO also can be deuterated both in the gas phase and on grain surfaces. However, extensive chemical models that incorporate both gas-phase and grain-surface reactions of large hydrocarbons, are necessary to study the chemical processes and clarify the relevance of these observed trends for the isotopic fractionation of the same functional group in different molecules.
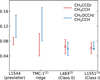 |
Fig. 10 Comparison of the deuteration of CH3CCH towards different cores. For L1544 and TMC-1, the given range covers minimum to maximum values across the cores, while for L483 and L1551 single values are given including error bars or upper limits. References include: (1) Markwick et al. (2005), (2) Agúndez et al. (2019), (3) Marchand et al. (2024). |
5 Conclusions
In this work, we studied the deuterium fraction of the carbon chains HC3N and CH3CCH in the pre-stellar core L1544. We analysed the emission of the species together with their singly deuterated isotopologues and HCC13CN. We derived the column densities of the different species, constraining them with non-LTE radiative transfer modelling of HC3N and CH3CCH. The corresponding deuterium fraction maps show different behaviours in terms of distribution and level of deuteration and seem to trace different physical conditions.
HC3N shows moderate levels of deuteration, with a very extended, homogeneous distribution. This suggests that HC3N and DC3N trace outer layers in the envelope of the core with intermediate-density gas rather than the dense core centre, and supports a gas-phase formation of DC3N. With non-LTE modelling, we derive a 12C/13C ratio of 60 ± 20 for HC3N towards the dust peak of L1544, which is consistent with the value for the local ISM, 68. CH2DCCH shows a clear deuteration peak away from the core centre, towards the north-east, coinciding with the CH3OH molecular peak. This is likely linked to the local density enhancement in this region that enhances the CO freeze-out and therefore increases deuteration and reactive desorption. CH3CCD, on the other hand, seems to be most efficiently formed closer to the centre of the core, where deuteration is also enhanced in other carbon chain such as c-C3H2 . CH2DCCH shows significantly higher levels of deuteration than CH3CCD and is about four to five times more abundant across the core, similar to that observed for deuterated CH3OH. This, together with the tentative trend of higher values towards the north, suggests different deuteration mechanisms for the two functional groups (CH3 and CCH) in L1544, with varying efficiency across the core.
Overall, the results of this work suggest that gas-phase reactions dominate the formation and deuteration of carbon chains in L1544, with spatial variations driven by physical structure, density, and external radiation. However, given the similarities of the deuterium fraction of CH3CCH and CH3OH, an additional deuteration pathway of CH3CCH might exist on the surfaces of dust grains. This shows the importance of understanding the ongoing chemical processes when using deuterated molecules as tools to study the interface between the dense core and the surrounding cloud.
Acknowledgements
We wish to thank the anonymous referee for their constructive comments. The authors wish to thank the Max Planck Society for financial support.
References
- Agúndez, M., Marcelino, N., Cernicharo, J., Roueff, E., & Tafalla, M. 2019, A&A, 625, A147 [Google Scholar]
- Agúndez, M., Roueff, E., Cabezas, C., Cernicharo, J., & Marcelino, N. 2021, A&A, 649, A171 [NASA ADS] [CrossRef] [EDP Sciences] [Google Scholar]
- Bauer, A., & Burie, J. 1969, C. R. Acad. Sci. Paris, B 268, 800 [Google Scholar]
- Ben Khalifa, M., Darna, B., & Loreau, J. 2024, A&A, 683, A53 [NASA ADS] [CrossRef] [EDP Sciences] [Google Scholar]
- Bianchi, E., Remijan, A., Codella, C., et al. 2023, ApJ, 944, 208 [NASA ADS] [CrossRef] [Google Scholar]
- Bizzocchi, L., Caselli, P., Spezzano, S., & Leonardo, E. 2014, A&A, 569, A27 [NASA ADS] [CrossRef] [EDP Sciences] [Google Scholar]
- Bonnor, W. B. 1956, MNRAS, 116, 351 [NASA ADS] [CrossRef] [Google Scholar]
- Buhl, D., & Snyder, L. E. 1973, in Molecules in the Galactic Environment, eds. M. A. Gordon, & L. E. Snyder, 187 [Google Scholar]
- Calcutt, H., Willis, E. R., Jørgensen, J. K., et al. 2019, A&A, 631, A137 [NASA ADS] [CrossRef] [EDP Sciences] [Google Scholar]
- Caselli, P., Walmsley, C. M., Tafalla, M., Dore, L., & Myers, P. C. 1999, ApJ, 523, L165 [Google Scholar]
- Caselli, P., Walmsley, C. M., Zucconi, A., et al. 2002a, ApJ, 565, 331 [NASA ADS] [CrossRef] [Google Scholar]
- Caselli, P., Walmsley, C. M., Zucconi, A., et al. 2002b, ApJ, 565, 344 [Google Scholar]
- Caselli, P., Pineda, J. E., Sipilä, O., et al. 2022, ApJ, 929, 13 [NASA ADS] [CrossRef] [Google Scholar]
- Chacón-Tanarro, A., Caselli, P., Bizzocchi, L., et al. 2019, A&A, 622, A141 [Google Scholar]
- Chapillon, E., Dutrey, A., Guilloteau, S., et al. 2012, ApJ, 756, 58 [NASA ADS] [CrossRef] [Google Scholar]
- Chantzos, J., Spezzano, S., Caselli, P., et al. 2018, ApJ, 863, 126 [CrossRef] [Google Scholar]
- Crapsi, A., Caselli, P., Walmsley, C. M., et al. 2005, ApJ, 619, 379 [Google Scholar]
- Creswell, R. A., Winnewisser, G., & Gerry, M. C. L. 1977, J. Mol. Spectrosc., 65, 420 [CrossRef] [Google Scholar]
- Dalgarno, A., & Lepp, S. 1984, ApJ, 287, L47 [NASA ADS] [CrossRef] [Google Scholar]
- Ebert, R. 1955, ZAp, 37, 217 [Google Scholar]
- Faure, A., Lique, F., & Wiesenfeld, L. 2016, MNRAS, 460, 2103 [NASA ADS] [CrossRef] [Google Scholar]
- Fontani, F., Cesaroni, R., Caselli, P., & Olmi, L. 2002, A&A, 389, 603 [NASA ADS] [CrossRef] [EDP Sciences] [Google Scholar]
- Fukuzawa, K., & Osamura, Y. 1997, ApJ, 489, 113 [Google Scholar]
- Fuller, G. A., & Myers, P. C. 1992, ApJ, 384, 523 [Google Scholar]
- Gerin, M., Combes, F., Wlodarczak, G., Encrenaz, P., & Laurent, C. 1992, A&A, 253, L29 [Google Scholar]
- Giers, K., Spezzano, S., Alves, F., et al. 2022, A&A, 664, A119 [NASA ADS] [CrossRef] [EDP Sciences] [Google Scholar]
- Giers, K., Spezzano, S., Caselli, P., et al. 2023, A&A, 676, A78 [NASA ADS] [CrossRef] [EDP Sciences] [Google Scholar]
- Giers, K., Spezzano, S., Lin, Y., et al. 2025, A&A, 699, A103 [NASA ADS] [CrossRef] [EDP Sciences] [Google Scholar]
- Ginsburg, A., Koch, E., Robitaille, T., et al. 2019, https://doi.org/10.5281/zenodo.2573901 [Google Scholar]
- Goldsmith, P. F., & Langer, W. D. 1999, ApJ, 517, 209 [Google Scholar]
- Gratier, P., Majumdar, L., Ohishi, M., et al. 2016, ApJS, 225, 25 [Google Scholar]
- Guzmán, A. E., Guzmán, V. V., Garay, G., Bronfman, L., & Hechenleitner, F. 2018, ApJS, 236, 45 [CrossRef] [Google Scholar]
- Hickson, K. M., Wakelam, V., & Loison, J.-C. 2016, Mol. Astrophys., 3, 1 [CrossRef] [Google Scholar]
- Hily-Blant, P., Faure, A., Vastel, C., et al. 2018, MNRAS, 480, 1174 [NASA ADS] [CrossRef] [Google Scholar]
- Howe, D. A., Millar, T. J., Schilke, P., & Walmsley, C. M. 1994, MNRAS, 267, 59 [NASA ADS] [Google Scholar]
- Iraqi, M., Petrank, A., Peres, M., & Lifshitz, C. 1990, Int. J. Mass Spectrom. Ion Processes, 100, 679 [Google Scholar]
- Juvela, M. 2020, A&A, 644, A151 [NASA ADS] [CrossRef] [EDP Sciences] [Google Scholar]
- Keto, E., Caselli, P., & Rawlings, J. 2015, MNRAS, 446, 3731 [NASA ADS] [CrossRef] [Google Scholar]
- Langer, W. D., Schloerb, F. P., Snell, R. L., & Young, J. S. 1980, ApJ, 239, L125 [Google Scholar]
- Leguennec, M., Demaison, J., Wlodarczak, G., & Marsden, C. 1993, J. Mol. Spectrosc., 160, 471 [Google Scholar]
- Lin, Y., Spezzano, S., Sipilä, O., Vasyunin, A., & Caselli, P. 2022a, A&A, 665, A131 [NASA ADS] [CrossRef] [EDP Sciences] [Google Scholar]
- Lin, Y., Wyrowski, F., Liu, H. B., et al. 2022b, A&A, 658, A128 [NASA ADS] [CrossRef] [EDP Sciences] [Google Scholar]
- Mallinson, P. D., & de Zafra, R. L. 1978, Mol. Phys., 36, 827 [NASA ADS] [CrossRef] [Google Scholar]
- Mangum, J. G., & Shirley, Y. L. 2015, PASP, 127, 266 [Google Scholar]
- Marchand, P., Coutens, A., Scigliuto, J., et al. 2024, A&A, 687, A195 [NASA ADS] [CrossRef] [EDP Sciences] [Google Scholar]
- Markwick, A. J., Charnley, S. B., Butner, H. M., & Millar, T. J. 2005, ApJ, 627, L117 [Google Scholar]
- Milam, S. N., Savage, C., Brewster, M. A., Ziurys, L. M., & Wyckoff, S. 2005, ApJ, 634, 1126 [Google Scholar]
- Morris, M., Turner, B. E., Palmer, P., & Zuckerman, B. 1976, ApJ, 205, 82 [CrossRef] [Google Scholar]
- Müller, H. S. P., Thorwirth, S., Roth, D. A., & Winnewisser, G. 2001, A&A, 370, L49 [Google Scholar]
- Öberg, K. I., Boamah, M. D., Fayolle, E. C., et al. 2013, ApJ, 771, 95 [CrossRef] [Google Scholar]
- Pagani, L., Salez, M., & Wannier, P. G. 1992, A&A, 258, 479 [NASA ADS] [Google Scholar]
- Parker, D. S. N., & Kaiser, R. I. 2017, Chem. Soc. Rev., 46, 452 [CrossRef] [Google Scholar]
- Pety, J. 2005, in SF2A-2005: Semaine de l’Astrophysique Francaise, eds. F. Casoli, T. Contini, J. M. Hameury, & L. Pagani, 721 [Google Scholar]
- Redaelli, E., Bizzocchi, L., Caselli, P., et al. 2019, A&A, 629, A15 [NASA ADS] [CrossRef] [EDP Sciences] [Google Scholar]
- Rivilla, V. M., Colzi, L., Fontani, F., et al. 2020, MNRAS, 496, 1990 [NASA ADS] [CrossRef] [Google Scholar]
- Sakai, N., Sakai, T., Hirota, T., & Yamamoto, S. 2009, ApJ, 702, 1025 [Google Scholar]
- Schiff, H. I., & Bohme, D. K. 1979, ApJ, 232, 740 [NASA ADS] [CrossRef] [Google Scholar]
- Schöier, F. L., van der Tak, F. F. S., van Dishoeck, E. F., & Black, J. H. 2005, A&A, 432, 369 [Google Scholar]
- Shingledecker, C. N., Lee, K. L. K., Wandishin, J. T., et al. 2021, A&A, 652, L12 [NASA ADS] [CrossRef] [EDP Sciences] [Google Scholar]
- Sims, I. R., Queffelec, J.-L., Travers, D., et al. 1993, Chem. Phys. Lett., 211, 461 [Google Scholar]
- Sipilä, O., Caselli, P., Redaelli, E., Juvela, M., & Bizzocchi, L. 2019, MNRAS, 487, 1269 [Google Scholar]
- Spezzano, S., Brunken, S., Schilke, P., et al. 2013, in 68th International Symposium on Molecular Spectroscopy, ETI08 [Google Scholar]
- Spezzano, S., Bizzocchi, L., Caselli, P., Harju, J., & Brünken, S. 2016, A&A, 592, L11 [NASA ADS] [CrossRef] [EDP Sciences] [Google Scholar]
- Spezzano, S., Caselli, P., Bizzocchi, L., Giuliano, B. M., & Lattanzi, V. 2017, A&A, 606, A82 [NASA ADS] [CrossRef] [EDP Sciences] [Google Scholar]
- Spezzano, S., Caselli, P., Sipilä, O., & Bizzocchi, L. 2022, A&A, 664, L2 [NASA ADS] [CrossRef] [EDP Sciences] [Google Scholar]
- Turner, B. E. 1971, ApJ, 163, L35 [NASA ADS] [CrossRef] [Google Scholar]
- Turner, B. E. 2001, ApJS, 136, 579 [Google Scholar]
- Turner, B. E., Terzieva, R., & Herbst, E. 1999, ApJ, 518, 699 [NASA ADS] [CrossRef] [Google Scholar]
- van Dishoeck, E. F., Blake, G. A., Jansen, D. J., & Groesbeck, T. D. 1995, ApJ, 447, 760 [Google Scholar]
- Vastel, C., Ceccarelli, C., Lefloch, B., & Bachiller, R. 2014, ApJ, 795, L2 [NASA ADS] [CrossRef] [Google Scholar]
- Vasyunin, A. I., Caselli, P., Dulieu, F., & Jiménez-Serra, I. 2017, ApJ, 842, 33 [Google Scholar]
- Walmsley, C. M., Winnewisser, G., & Toelle, F. 1980, A&A, 81, 245 [NASA ADS] [Google Scholar]
- Walmsley, C. M., Flower, D. R., & Pineau des Forêts, G. 2004, A&A, 418, 1035 [NASA ADS] [CrossRef] [EDP Sciences] [Google Scholar]
- Ward-Thompson, D., Motte, F., & Andre, P. 1999, MNRAS, 305, 143 [Google Scholar]
- Wes McKinney. 2010, in Proceedings of the 9th Python in Science Conference, eds. Stéfan van der Walt & Jarrod Millman, 56 [Google Scholar]
Appendix A Additional material on deuteration maps
Appendix A.1 Uncertainties of deuteration maps
Figure A.1 shows the uncertainties on the deuteration maps of HC3N and CH3CCH presented in Figs. 8 and 9, respectively.
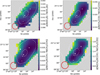 |
Fig. A.1 Error maps of the deuteration maps for HC3N and CH3CCH (presented in Figs. 8 and 9, respectively). Only pixels above the 3σ level of the respective integrated intensities are plotted. The dashed line contours represent 30%, 50%, and 90% of the H2 column density peak derived from Herschel maps (Spezzano et al. 2016). The circle in the bottom-left corner indicates the beam size of the IRAM 30 m telescope (31″). The markers in white represent the dust peak (triangle) and the molecular emission peaks of CH3OH (diamond), CH3CCH (star), and c-C3H2 (plus sign). |
Appendix A.2 Deuteration of CH3CCH derived from K=1
Figure A.2 shows the column density map of CH3CCH derived from the (51−41) transition and the resulting deuteration maps. The distribution of the emission of the K=1 transition is identical to the K=0 transition, resulting in an identical morphology the deuterium fraction. However, the peak column density derived from K=1 with an excitation temperature of 10K is a factor of 2 higher compared to the values derived from K=0. This results in substantially lower deuteration levels, with peak values of 0.045(5) and 0.07(1) for N(CH3CCD)/N(CH3CCH) and N(CH2DCCH)/N(CH3CCH), respectively. However, the relation between the two deuterated isotopologues does not change, and therefore, the conclusions drawn from them are not affected.
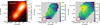 |
Fig. A.2 Left: Column density map of CH3CCH derived with the (51−41) transition. The solid contour indicates the 3σ level of the column density. The markers represent the dust peak (triangle) and the molecular emission peaks of CH3OH (diamond), CH3CCH (star), and c-C3H2 (plus sign). Right: Corresponding deuteration maps. Only pixels above the 3σ level of the respective integrated intensities are plotted. |
Appendix B Spectra at molecular peaks
Figure B.1 presents spectra of the observed transitions, extracted towards the three molecular emission peaks (CH3OH, CH3CCH, c-C3H2) and the dust peak of L1544, by using a circular aperture with a diameter corresponding to the telescope beam size (31″). CH3 CCH and CH2DCCH are only represented with one transition each, as they are discussed separately in Sect. 3 and Fig. 2.
The extraction locations of the spectra are marked in Fig. 1. The corresponding linewidths and velocities of the spectra at the four extraction locations are derived with Gaussian fitting and given in Table B.1.
The spectra show that the brightest emission of all observed molecules is detected towards the c-C3H2 peak located in the south of the core. In this region, the core is less protected from the ISRF, which drives photochemistry and leads to an active carbon chemistry and an increased abundance of C-bearing species. As all observed molecules in this study are essentially carbon chains, they are most efficiently formed in such conditions. However, the linewidths observed towards the CH3CCH peak (and the dust peak) are significantly larger than towards the c-C3H2 peak. This indicates the location where the flow of material from the outer regions of the core (in the direction of the main filament) reaches the dense core and undergoes a local slow shock (as in the case of CH3OH at the CH3OH peak, see Lin et al. 2022a), causing broader linewidths. The spectra of DC3N seem to show rather flat line profiles towards the CH3CCH peak. As DC3N is tracing less dense gas in the outer envelope of the core, the broader linewidth is likely caused by the larger turbulence present in those outer parts (e.g. Fuller & Myers 1992).
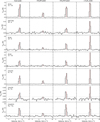 |
Fig. B.1 Spectra of the observed transitions, extracted at the dust peak, the CH3OH peak, the CH3CCH peak, and the c-C3H2 peak of L1544. The extraction locations of the spectra, as well as the telescope beam used as aperture, are indicated in Fig. 1. The horizontal line indicates the 3σ confidence level, and the vertical line indicates the systemic velocity of the source. |
All Tables
All Figures
|
Fig. 1 Integrated intensity maps of the observed transitions. The grey solid line contours indicate the 30%, 70%, and 90% level of the peak integrated intensity. The dashed line contours represent 30%, 50%, and 90% of the H2 column density peak derived from Herschel maps (Spezzano et al. 2016). The markers in blue represent the dust peak (triangle) and the molecular emission peaks of CH3OH (diamond), CH3CCH (star), and c-C3H2 (plus sign), where emission spectra (shown in Fig. 2) are extracted within a circular aperture with a diameter corresponding to the telescope beam. The white circle in the bottom-left corner indicates the beam size of the IRAM 30 m telescope (31″). |
| In the text | |
|
Fig. 2 Observed spectra (black) of the CH3CCH (top) and the CH3CCD (bottom) K=0 and K=1 transitions extracted towards the three molecular peaks in L1544 and the dust peak, using a circular aperture with diameter 31″. The extraction locations are indicated in Fig. 1. Shown in red are synthetic spectra produced with the LTE model generator of the python package pyspeckit. The input column densities are [4, 2, 5, 8](±0.3) × 1013 cm−2 for CH3CCH and [3, 1, 4, 5](±0.3) × 1012 cm−2 for CH3CCD at the dust peak, CH3OH peak, CH3CCH peak, and c-C3H2 peak, respectively. The input excitation temperature is set to a constant value of 10 K for both molecules. |
| In the text | |
|
Fig. 3 Profiles of the gas temperature (red), H2 number density (orange, in logarithmic scale), and infall velocity (blue, in units of 0.1 km s−1) for the Keto-Caselli model of L1544 (Keto et al. 2015). The velocity in the model is negative but is shown here as positive to improve readability. |
| In the text | |
|
Fig. 4 Fractional abundance profiles of HC3N (solid) and CH3CCH (dashed) of the best-fit results produced with LOC. For HCC13CN, the radial abundance profiles derived with chemical modelling (green, red) correspond to the profiles of the main isotopologue, scaled down by the isotopic ratio, 68. |
| In the text | |
|
Fig. 5 Comparison of the observed spectra (grey) of HC3N, and HCC13CN, extracted towards the dust peak of L1544, to the synthetic spectra (red, blue, green) produced with LOC. For the constant abundances, a depletion radius of 1800 au is assumed. |
| In the text | |
|
Fig. 6 Comparison of the observed spectra (grey) of CH3CCH, extracted towards the dust peak of L1544, to the synthetic spectra (red, blue, green) produced with LOC. For the constant abundances, a depletion radius of 1800 au is assumed. |
| In the text | |
|
Fig. 7 Column density maps of HC3N and CH3CCH and their deuterated isotopologues. The column densities are derived with a constant excitation temperature of 7 K and 10 K for HC3N and CH3CCH and their isotopologues, respectively, and are corrected for optical depth. To derive the column density of HC3N, we used the emission of HCC13CN, assuming a constant 12C/13C=68 (Milam et al. 2005). The solid line contours indicate the 3σ level of the integrated intensity. The dashed line contours represent 30%, 50%, and 90% of the H2 column density peak derived from Herschel maps (Spezzano et al. 2016). The circle in the bottom-left corner indicates the beam size of the IRAM 30 m telescope (31″). The markers in grey represent the dust peak (triangle) and the molecular emission peaks of CH3OH (diamond), CH3CCH (star), and c-C3H2 (plus sign). |
| In the text | |
|
Fig. 8 Deuteration map of HC3N. Only pixels above the 3σ level of the respective integrated intensities are plotted. The dashed line contours represent 30%, 50%, and 90% of the H2 column density peak derived from Herschel maps (Spezzano et al. 2016). The circle in the bottomleft corner indicates the beam size of the IRAM 30m telescope (31″). The markers in black represent the dust peak (triangle) and the molecular emission peaks of CH3OH (diamond), CH3CCH (star), and c-C3H2 (plus sign). The corresponding D/H error map is shown in Fig. A.1. |
| In the text | |
|
Fig. 9 Deuteration maps of CH3CCH. Only pixels above the 3σ level of the respective integrated intensities are plotted. The dashed line contours represent 30%, 50%, and 90% of the H2 column density peak derived from Herschel maps (Spezzano et al. 2016). The circle in the bottom-left corner indicates the beam size of the IRAM 30 m telescope (31″). The markers in black represent the dust peak (triangle) and the molecular emission peaks of CH3OH (diamond), CH3CCH (star), and c-C3H2 (plus sign). The corresponding D/H error maps are shown in Fig. A.1. |
| In the text | |
|
Fig. 10 Comparison of the deuteration of CH3CCH towards different cores. For L1544 and TMC-1, the given range covers minimum to maximum values across the cores, while for L483 and L1551 single values are given including error bars or upper limits. References include: (1) Markwick et al. (2005), (2) Agúndez et al. (2019), (3) Marchand et al. (2024). |
| In the text | |
|
Fig. A.1 Error maps of the deuteration maps for HC3N and CH3CCH (presented in Figs. 8 and 9, respectively). Only pixels above the 3σ level of the respective integrated intensities are plotted. The dashed line contours represent 30%, 50%, and 90% of the H2 column density peak derived from Herschel maps (Spezzano et al. 2016). The circle in the bottom-left corner indicates the beam size of the IRAM 30 m telescope (31″). The markers in white represent the dust peak (triangle) and the molecular emission peaks of CH3OH (diamond), CH3CCH (star), and c-C3H2 (plus sign). |
| In the text | |
|
Fig. A.2 Left: Column density map of CH3CCH derived with the (51−41) transition. The solid contour indicates the 3σ level of the column density. The markers represent the dust peak (triangle) and the molecular emission peaks of CH3OH (diamond), CH3CCH (star), and c-C3H2 (plus sign). Right: Corresponding deuteration maps. Only pixels above the 3σ level of the respective integrated intensities are plotted. |
| In the text | |
|
Fig. B.1 Spectra of the observed transitions, extracted at the dust peak, the CH3OH peak, the CH3CCH peak, and the c-C3H2 peak of L1544. The extraction locations of the spectra, as well as the telescope beam used as aperture, are indicated in Fig. 1. The horizontal line indicates the 3σ confidence level, and the vertical line indicates the systemic velocity of the source. |
| In the text | |
Current usage metrics show cumulative count of Article Views (full-text article views including HTML views, PDF and ePub downloads, according to the available data) and Abstracts Views on Vision4Press platform.
Data correspond to usage on the plateform after 2015. The current usage metrics is available 48-96 hours after online publication and is updated daily on week days.
Initial download of the metrics may take a while.