Fig. A.2
Download original image
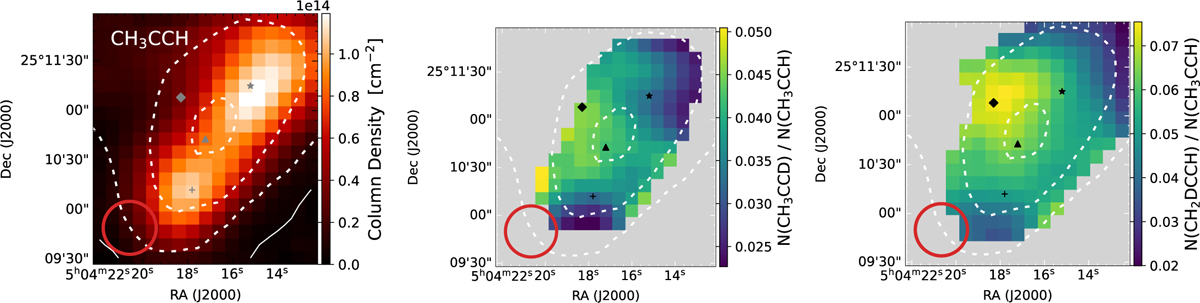
Left: Column density map of CH3CCH derived with the (51−41) transition. The solid contour indicates the 3σ level of the column density. The markers represent the dust peak (triangle) and the molecular emission peaks of CH3OH (diamond), CH3CCH (star), and c-C3H2 (plus sign). Right: Corresponding deuteration maps. Only pixels above the 3σ level of the respective integrated intensities are plotted.
Current usage metrics show cumulative count of Article Views (full-text article views including HTML views, PDF and ePub downloads, according to the available data) and Abstracts Views on Vision4Press platform.
Data correspond to usage on the plateform after 2015. The current usage metrics is available 48-96 hours after online publication and is updated daily on week days.
Initial download of the metrics may take a while.