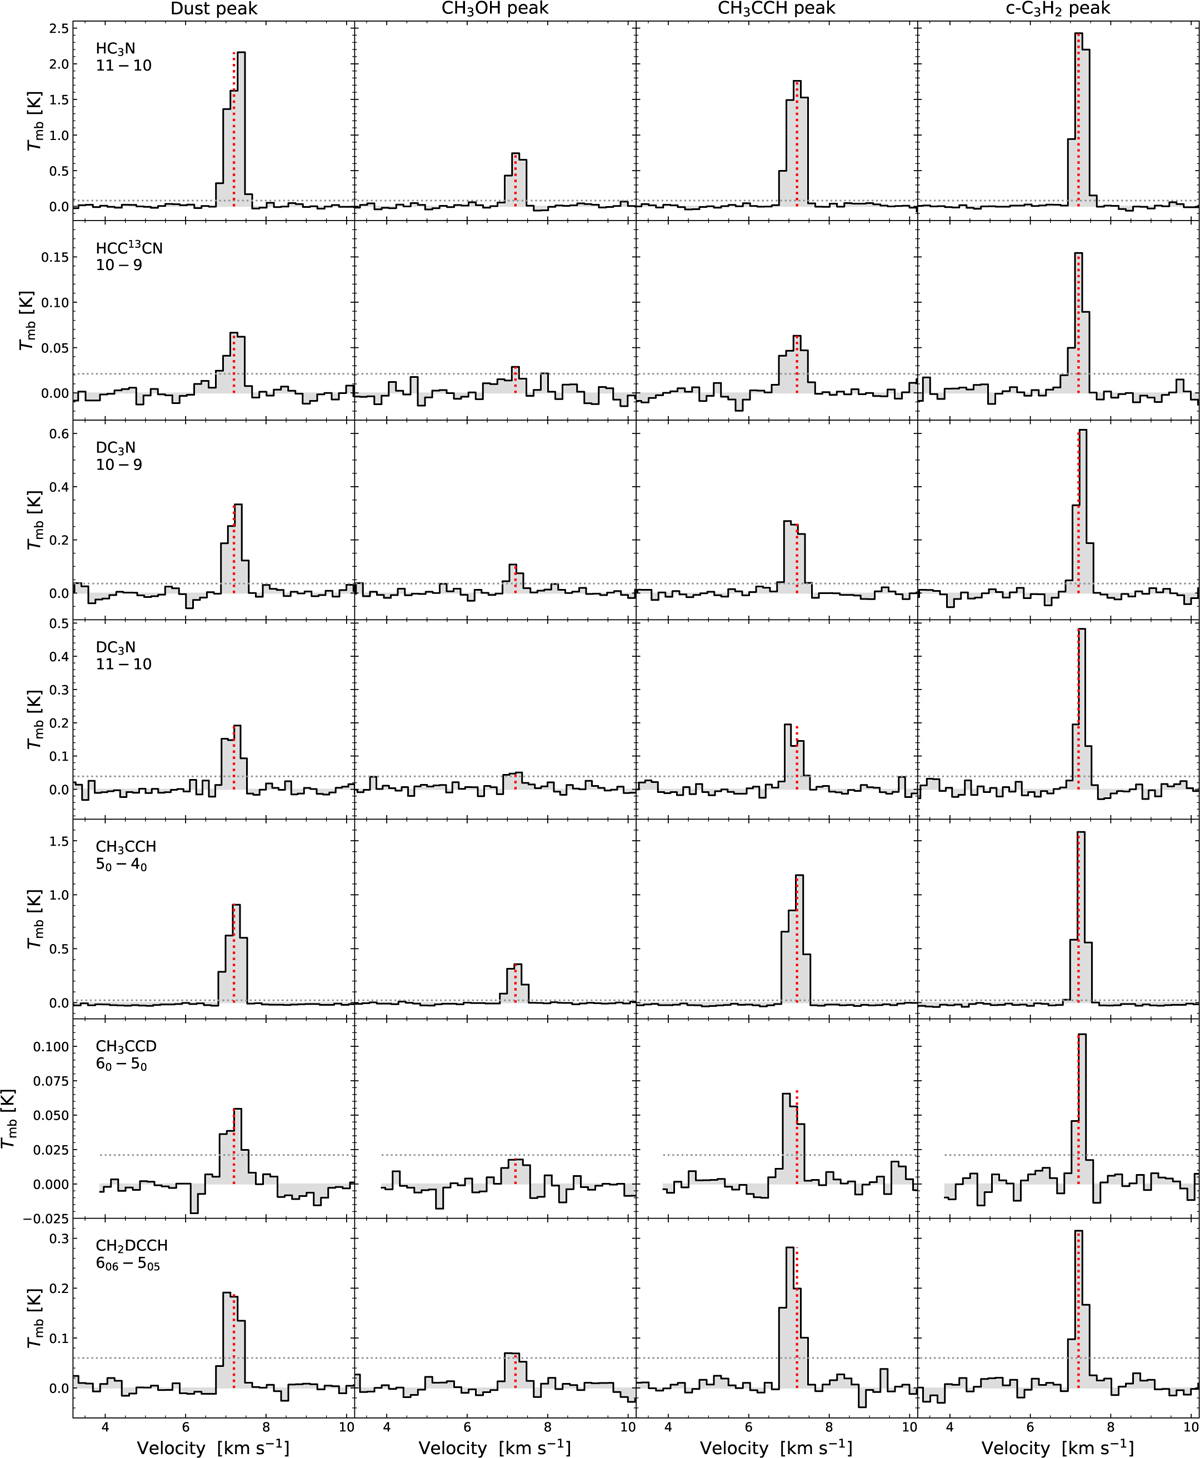
Fig. B.1
Download original image
Spectra of the observed transitions, extracted at the dust peak, the CH3OH peak, the CH3CCH peak, and the c-C3H2 peak of L1544. The extraction locations of the spectra, as well as the telescope beam used as aperture, are indicated in Fig. 1. The horizontal line indicates the 3σ confidence level, and the vertical line indicates the systemic velocity of the source.
Current usage metrics show cumulative count of Article Views (full-text article views including HTML views, PDF and ePub downloads, according to the available data) and Abstracts Views on Vision4Press platform.
Data correspond to usage on the plateform after 2015. The current usage metrics is available 48-96 hours after online publication and is updated daily on week days.
Initial download of the metrics may take a while.