Fig. 2
Download original image
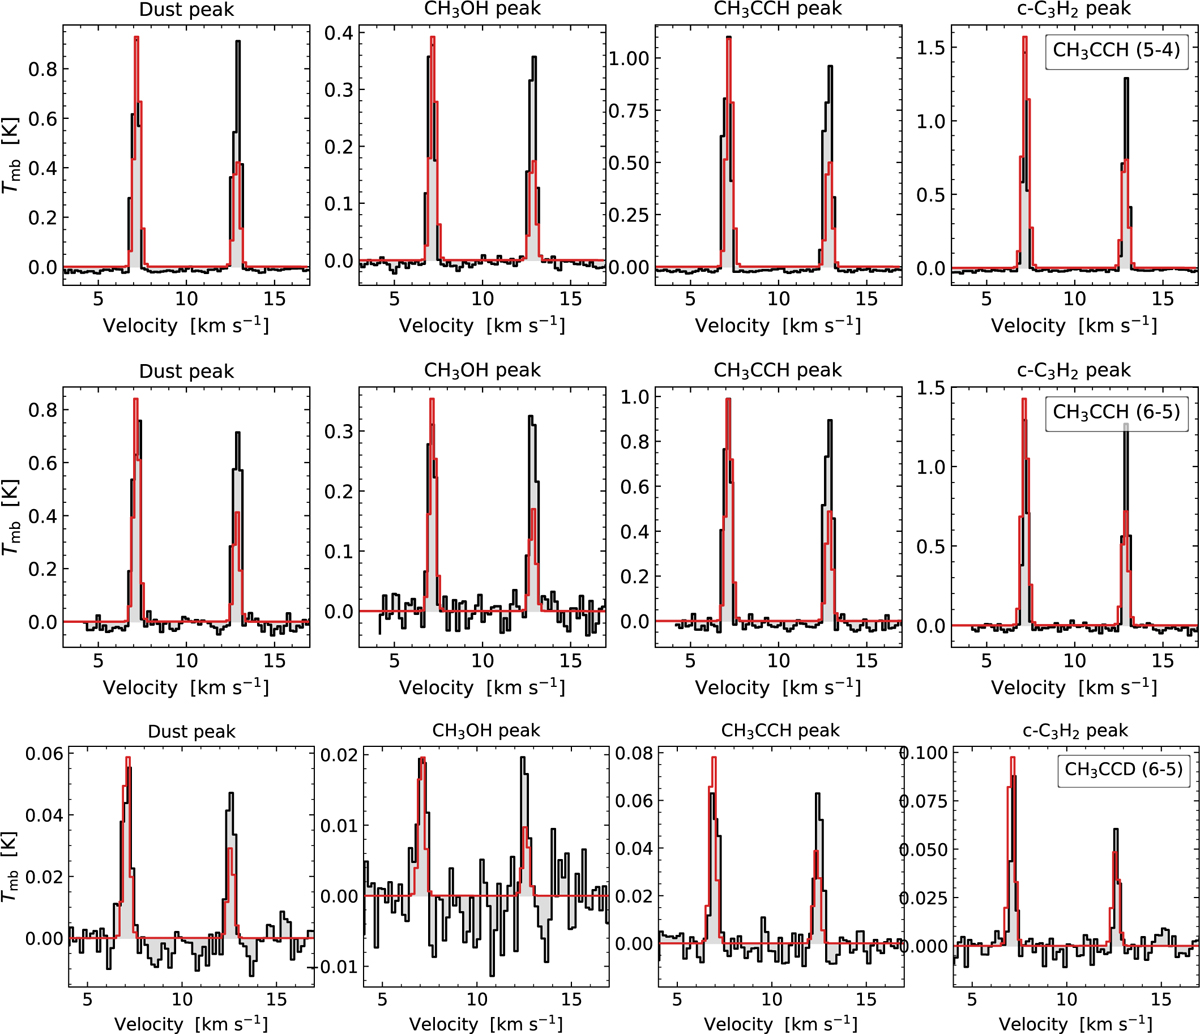
Observed spectra (black) of the CH3CCH (top) and the CH3CCD (bottom) K=0 and K=1 transitions extracted towards the three molecular peaks in L1544 and the dust peak, using a circular aperture with diameter 31″. The extraction locations are indicated in Fig. 1. Shown in red are synthetic spectra produced with the LTE model generator of the python package pyspeckit. The input column densities are [4, 2, 5, 8](±0.3) × 1013 cm−2 for CH3CCH and [3, 1, 4, 5](±0.3) × 1012 cm−2 for CH3CCD at the dust peak, CH3OH peak, CH3CCH peak, and c-C3H2 peak, respectively. The input excitation temperature is set to a constant value of 10 K for both molecules.
Current usage metrics show cumulative count of Article Views (full-text article views including HTML views, PDF and ePub downloads, according to the available data) and Abstracts Views on Vision4Press platform.
Data correspond to usage on the plateform after 2015. The current usage metrics is available 48-96 hours after online publication and is updated daily on week days.
Initial download of the metrics may take a while.