Fig. 8
Download original image
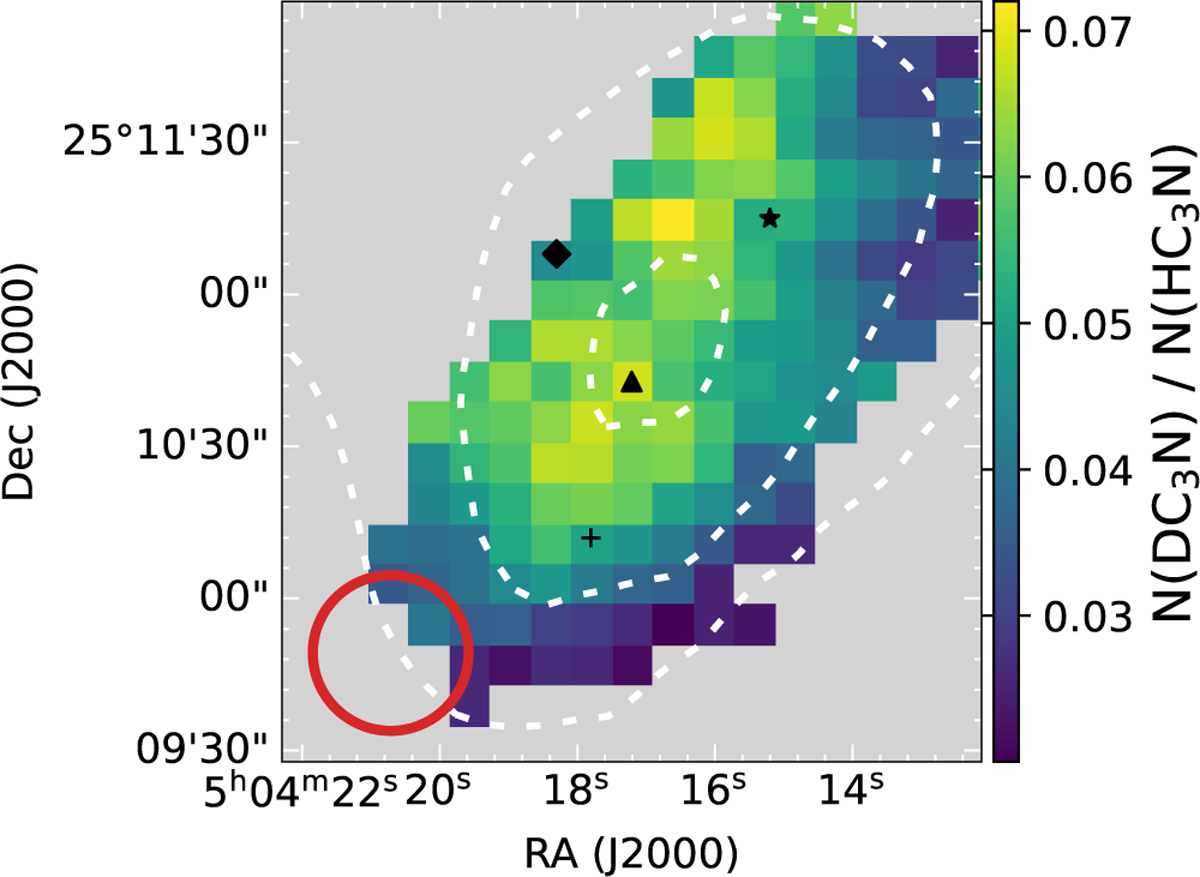
Deuteration map of HC3N. Only pixels above the 3σ level of the respective integrated intensities are plotted. The dashed line contours represent 30%, 50%, and 90% of the H2 column density peak derived from Herschel maps (Spezzano et al. 2016). The circle in the bottomleft corner indicates the beam size of the IRAM 30m telescope (31″). The markers in black represent the dust peak (triangle) and the molecular emission peaks of CH3OH (diamond), CH3CCH (star), and c-C3H2 (plus sign). The corresponding D/H error map is shown in Fig. A.1.
Current usage metrics show cumulative count of Article Views (full-text article views including HTML views, PDF and ePub downloads, according to the available data) and Abstracts Views on Vision4Press platform.
Data correspond to usage on the plateform after 2015. The current usage metrics is available 48-96 hours after online publication and is updated daily on week days.
Initial download of the metrics may take a while.