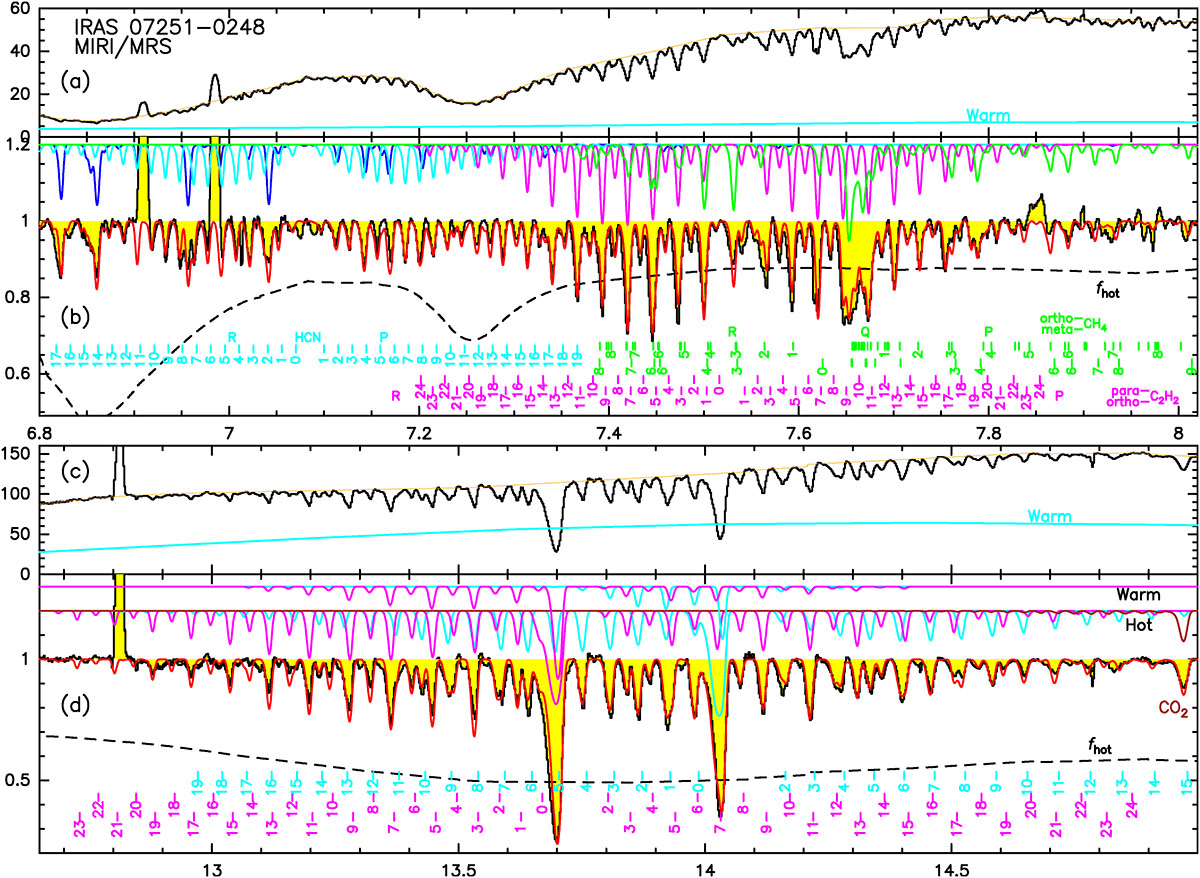
Fig. F.1.
Download original image
HCN, C2H2, and CH4 bands in IRAS 07251−0248 observed with JWST MIRI/MRS, and model fit. Abscissae are rest wavelengths in μm. Panels a and c show the observed spectra around 7.5 and 14 μm (flux densities in mJy), with the orange line indicating the adopted continuum level (i.e., the baseline) and the light-blue curve showing the contribution to the continuum by the WC. Panels b and d show the continuum normalized spectrum, with the red line showing the model result and the dashed line indicating the covering factor of the hot component (fhot). The contributions to the model by HCN, C2H2, CH4, and CO2 (and their transition labels) are indicated in light-blue, magenta, green, and brown, respectively (and vertically shifted for clarity). Note that all absorption features are blueshifted relative to the labels.
Current usage metrics show cumulative count of Article Views (full-text article views including HTML views, PDF and ePub downloads, according to the available data) and Abstracts Views on Vision4Press platform.
Data correspond to usage on the plateform after 2015. The current usage metrics is available 48-96 hours after online publication and is updated daily on week days.
Initial download of the metrics may take a while.