| Issue |
A&A
Volume 706, February 2026
|
|
|---|---|---|
| Article Number | A227 | |
| Number of page(s) | 16 | |
| Section | Extragalactic astronomy | |
| DOI | https://doi.org/10.1051/0004-6361/202556762 | |
| Published online | 10 February 2026 | |
The CON-quasar stage of IRAS 07251−0248 E
1
Universidad de Alcalá, Departamento de Física y Matemáticas, Campus Universitario E-28871 Alcalá de Henares Madrid, Spain
2
Instituto de Física Fundamental, CSIC Calle Serrano 123 E-28006 Madrid, Spain
3
Centro de Astrobiología (CAB), CSIC-INTA, Camino Bajo del Castillo s/n Villanueva de la Cañada E-28692 Madrid, Spain
4
George Mason University, Department of Physics & Astronomy, MS 3F3 4400 University Drive Fairfax VA 22030, USA
★ Corresponding author: This email address is being protected from spambots. You need JavaScript enabled to view it.
Received:
5
August
2025
Accepted:
30
November
2025
Abstract
ALMA continuum measurements of the local ultra-luminous galaxy IRAS 07251−0248 E at 667 μm reveal an extremely compact (R ≲ 27 pc) and bright (TB ≳ 200 K) nucleus with an absorbing foreground envelope and a surrounding (R ∼ 75 pc) disk or torus seen nearly face-on. The bright and unresolved nuclear emission implies large optical depths (τ667 μm ≳ 0.5, corresponding to NH ≳ 1025 cm−2) of hot dust at ≳500 K. In addition, JWST observations of the source show strong mid-infrared (mid-IR) absorption in the ro-vibrational bands of H2O ν2 = 1 − 0 (5 − 7 μm) and of other species including CO, HCN, C2H2, CH4, and CO2, and Herschel/PACS observations exhibit strong and saturated absorption due to OH, H2O, CH+, and CH. We propose a model in which the unresolved ALMA submillimeter and JWST mid-IR continua trace the same nuclear source, the former penetrating deep into the nucleus and the latter probing the nuclear photosphere. The continuum model, which includes trapping of photons (the “greenhouse” effect), indicates that the nuclear (Rh ≈ 13 pc) luminosity and luminosity surface density are ∼1012 L⊙ and Σbol ≈ 5 × 10⁸ L⊙ pc−2, arising from an active galactic nucleus (AGN) so buried that high-ionization lines are completely obscured. The observed mid-IR gas-phase molecular bands probe outflowing gas with velocities of ∼160 km s−1 and are reproduced with the predicted Tdust profile, while the far-IR molecular absorption lines are generated in the surrounding thick disk or torus with τ100 μm ∼ 10. We conclude that IRAS 07251−0248 harbors a compact obscured nucleus (CON) that hides an AGN currently emitting at quasar luminosity. While the observed outflow could be driven by radiation pressure, we favor the scenario of a (partially) energy-conserving hot bubble caught in a very early phase of the expulsion of the highly concentrated gas at the galactic nucleus.
Key words: ISM: general / ISM: jets and outflows / galaxies: active / ISM: individual objects: IRAS 07251-0248 E
© The Authors 2026
 Open Access article, published by EDP Sciences, under the terms of the Creative Commons Attribution License (https://creativecommons.org/licenses/by/4.0), which permits unrestricted use, distribution, and reproduction in any medium, provided the original work is properly cited.
This article is published in open access under the Subscribe to Open model. This email address is being protected from spambots. You need JavaScript enabled to view it. to support open access publication.
1. Introduction
Compact obscured nuclei (CONs, e.g., Falstad et al. 2021), are bright < 100 pc galaxy nuclei with extremely high column densities (NH2 ≳ 1025 cm−2). They have been mainly identified via the detection of HCN vibrational emission in the millimeter (e.g., Aalto et al. 2015; Falstad et al. 2019), by molecular lines in absorption in the far-infrared (IR, e.g., González-Alfonso et al. 2004, 2015), and through the PAH equivalent width method (García-Bernete et al. 2022a, 2025a). Their power source is, however, hard to establish due to the high nuclear extinction. Even the luminosity arising from these nuclei is difficult to establish from the millimeter continuum and lines observed with high resolution because the trapping of dust-emitted photons increases the dust temperature (Td) within the nucleus (González-Alfonso & Sakamoto 2019) (hereafter gon19), and the luminosity depends on Td at the nuclear surface (the “photosphere”), which is better probed with molecular absorption lines. Nevertheless, there is growing evidence that CONs typically harbor an active galactic nucleus (AGN) based on the extremely compact millimeter continuum emission compared to the more extended gas mass distribution, as observed with ALMA (Pereira-Santaella et al. 2021). Still, accurate IR to millimeter continuum models, together with detailed analysis of the hottest dust mid-IR emission from CONs, are scarce.
Here we combine ALMA, James Webb Space Telescope (JWST), and Herschel observations of the eastern (E) nucleus of IRAS 07251−0248 to model its continuum emission from mid-IR to submillimeter (submm) wavelengths. IRAS 07251−0248 is a merging ultra-luminous infrared galaxy (ULIRG) with an IR (6–1500 μm) luminosity of 1012.45 L⊙ and nuclear separation of ∼1.8 kpc (Lamperti et al. 2022); its E-nucleus dominates the total luminosity, contributing 91% (Pereira-Santaella et al. 2021). There are no reported observations of HCN vibrational emission from the galaxy, but there are other significant indications that it harbors a CON from the strong absorption in the OH 65 μm doublet (González-Alfonso et al. 2015), the 6.2/3.3 μm PAH equivalent-width ratio (García-Bernete et al. 2025a), and the absorption below the continuum in the blueshifted wing of the CO 2-1 line (Lamperti et al. 2022). IRAS 07251−0248 is very faint in the Chandra soft X-ray band (0.5 − 2 keV) and undetected in the hard bands of Chandra (2 − 7 keV, Iwasawa et al. 2011) and NuSTAR (10 − 24 keV, Ricci et al. 2021). On the other hand, JWST observations have recently shown that the source has a nuclear cosmic-ray dominated chemistry as derived from the high abundances of H3+ (Pereira-Santaella et al. 2024), hydrocarbons (García-Bernete et al. 2025b), and molecular cations (Speranza et al. 2025). We adopt luminosity and angular distances of DL = 400 Mpc and DA = 339 Mpc (scale of 1.64 pc/mas), respectively.
2. Observations and results
2.1. ALMA observations of the 667 μm continuum and model
ALMA observations at νobs = 413.11 GHz (Band 8, λrest = 667 μm) of IRAS 07251−0248 E (program 2023.1.00942.S, PI: M. Pereira-Santaella) were carried out on November 28, 2023 using the 12 m array with high angular resolution (75 × 67 mas2 = 123 × 110 pc2) and sensitivity (0.2 mJy/beam). Details of the reduction process are given in Appendix A. The map of the 667 μm continuum (Fig. 1) shows a very bright (peak of ≈25 mJy/beam) and compact emission. To derive its size and flux, we used the method described in Pereira-Santaella et al. (2021) and attempted to fit the observed emission with a point-source, a Gaussian, and a point-source and a Gaussian (pG). The best fit, shown in Fig. 1b, was found for the pG model with parameters listed in Table 1. Appendix A shows that the point-source and the Gaussian fits can be disregarded.
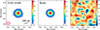 |
Fig. 1. ALMA 667 μm continuum emission of IRAS 07251−0248 E and model. Left: Observed emission, with colored scale in units of mJy/beam. Middle: Model, composed of an unresolved source (full-width at half maximum, FWHM < 21 mas = 34 pc) and a Gaussian source (FWHM = 89 × 86 mas2 = 146 × 141 pc2). Right: Residuals in μJy/beam. |
Best-fit parameters for the nuclear 667 μm emission of IRAS 07251−0248 E using a point-source + a Gaussian model.
Due to the high signal-to-noise ratio of the 667 μm emission (> 120), the unresolved source of the pG model was constrained to have an upper limit for the deconvolved size of FWHM ≤ 21 mas = 34 pc, assuming a Gaussian light distribution. Conservatively using the equivalence between a Gaussian source and a disk of uniform brightness (radius ≈ 0.8 × FWHM, Sakamoto et al. 2008), an upper limit for the nuclear source radius is R ≲ 27 pc, yielding a brightness of TB ≳ 190 K. The 667 μm emission is entirely attributed to dust, with the optical depth given by
 (1)
(1)
where k is the Boltzman constant (in cgs units), λ0 = 667 μm, DL = 400 Mpc, F667 μm is in mJy, Td is the dust temperature in K, and the source radius R is in pc. Using Td = 500 K, Eq. (1) gives τ667 μm = 0.5 for R = 27 pc, and has no solution for R ≤ 16 pc. Therefore, the ALMA observations reveal an extremely compact source with a very high column density of hot dust, and will be denoted as the “hot component” (HC).
For the Gaussian (resolved) continuum source, a size of FWHM = 89 × 86 mas2 is found, corresponding to a source (most likely a disk or a torus) seen nearly face-on with a radius of R ≈ 75 pc. Equation (1) gives τ667 μm ≈ 0.26 for an adopted Td = 123 K (Section 3.1). This component will be denoted as the “warm component” (WC).
The spectral energy distribution (SED) of IRAS 07251−0248 E from near-IR to millimeter wavelengths, including JWST (Section 2.2), Spitzer, Herschel/PACS and SPIRE, and ALMA data, is shown in Fig. 2. At 667 μm, we plot separately the flux densities for the HC (blue) and WC (light-blue); the black filled circle is the sum of both and lies below the extrapolation of the Herschel/SPIRE data, indicating that a fraction of the total 667 μm emission from the merger is spatially filtered out by ALMA. The continuum measurements at 1.2 mm are included (Table 3 in Pereira-Santaella et al. 2021), where the black open circle indicates the unresolved emission (R < 82 pc, which is large enough to include the emission from the HC and WC), and the cross indicates the resolved emission (∼500 × 300 pc2).
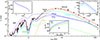 |
Fig. 2. Spectral energy distribution (SED) of IRAS 07251−0248 E from λrest = 2.6 to 1200 μm and model. In black, the full JWST NIRSpec & MIRI/MRS spectrum is shown, together with Spitzer, Herschel/PACS (from 60 to 160 μm, both photometric and spectroscopic) and SPIRE (from 230 to 470 μm), and ALMA (667 and 1200 μm) data. The colored circles at 667 μm indicate the contributions by the unresolved (blue) and resolved (light-blue) components inferred from the model in Fig. 1. At 1.2 mm, the open black circle and the cross indicate the flux densities of the unresolved (< 82 pc) and resolved (540 × 330 pc2) components, respectively (Pereira-Santaella et al. 2021). The model includes the HC in blue (dashed: unattenuated emission; solid: attenuated), the WC in light-blue (extincted), a cold component (CC) in orange, the stellar component in gray, and the “hidden” component (whose attenuated emission is added to that of the WC, see Section 3.2) in dotted-dashed green. Red is total. The insert panels show details of the model results. Upper left: The Tdust profile of the HC. Upper right: The optical depths τ of the HC and the WC as function of wavelength. Lower middle: The Tdust profile of the HC as function of the optical depth from surface at 7 and 14 μm. |
2.2. JWST observations of the mid-IR continuum and molecular bands
The JWST observations of IRAS 07251−0248 E, recently presented by García-Bernete et al. (2025b) and Speranza et al. (2025), were carried out as part of the JWST GO Cycle 2 Large Program #ID:3368 (P.I. L. Armus and A. Evans) including NIRSpec and MIRI/MRS integral field spectroscopy of the nucleus. Details of the reduction process are given in Appendix B.
The JWST spectrum (Fig. 2) is characterized by deep absorption of both solid- and gas-phase bands. Besides the silicate 9.7 μm and 18 μm features, there are deep absorption features due to H2O ice at 3 (stretching), 6 (bending), and 13 μm (libration), and due to hydrogenated amorphous carbon (a-C:H) grains at 6.85 and 7.25 μm. Superposed on this absorbed continuum, strong gas-phase absorption bands due to CO, CO2, H2O, HCN, and C2H2 are detected, as well as additional weaker bands mostly associated with hydrocarbons (García-Bernete et al. 2025b) and molecular cations (Speranza et al. 2025). In this absorption-dominated mid-IR spectrum, no high ionization lines that would directly probe an AGN are detected (Spoon et al. 2022). Here we focus on the H2O ν2 = 1 − 0 band at ∼5.2 − 7.0 μm displayed in Fig. 3, although the HCN, C2H2, CH4, and CO2 bands are also modeled in Appendix F. The H2O ν2 = 1 − 0 band has previously been reported in extragalactic sources by García-Bernete et al. (2024b, 2025b), González-Alfonso et al. (2024), Buiten et al. (2024, 2025). We used the H2O spectroscopic parameters tabulated in the HITRAN2020 database (Gordon et al. 2022).
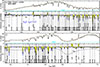 |
Fig. 3. H2O ν2 = 1 − 0 band in IRAS 07251−0248 observed with JWST MIRI/MRS. Panels a and c show the observed spectrum, with the orange line indicating the adopted continuum level and the light-blue curve showing the contribution from the warm component. Panels b and d show the continuum normalized spectrum, with the blue line showing the model result for the hot component and the dashed line indicating its covering factor (fhot). We label the main transitions that potentially contribute to the H2O band as shown in González-Alfonso et al. (2024), but some very highly-excited lines are not detected in IRAS 07251−0248. Note that all H2O absorption features are blueshifted relative to the labels. |
Properties of the components used to model the continuum and the H2O ν2 = 1 − 0 band in IRAS 07251−0248 E.
The H2O band in IRAS 07251−0248 E shows some similarities with, but also important differences from, that observed towards the lower luminosity LIRG VV 114 E SW-s2 (González-Alfonso et al. 2024). In both sources, the bands are in pure absorption (in contrast with that observed in the LIRG II Zw96-D1, where the P branch is in emission; García-Bernete et al. 2024b). However, the continuum-normalized absorption due to low-excitation H2O lines in IRAS 07251−0248 E is stronger than in VV 114 (see, e.g., the blended feature at ≈6.05 μm absorbing ≈70% of the continuum in IRAS 07251−0248 but only ≈35% in VV 114). The opposite happens with the very high-excitation H2O lines, which are strong in VV 114 but most of them (above ∼1500 K) undetected in IRAS 07251−0248 (see also Fig. D.2), indicating significantly lower excitation in this ULIRG (∼200 K, García-Bernete et al. 2025b). Interestingly, both sources show the H2O lines blueshifted by ∼160 km s−1 relative to the emission lines (Fig. D.1), but the blueshift in VV 114 increases with higher line excitation while the opposite happens in IRAS 07251−0248 E. Close inspection of the H2O line profiles in Figs. D.1 and D.2 indicates the presence of two kinematic components, and the most blueshifted one (with absorption at velocities up to −500 km s−1) is only seen in the low excitation lines.
3. A model for the mid-IR to millimeter continuum
3.1. The continuum model
Since ALMA observations at 667 μm reveal an HC with an extreme column density of hot dust that is expected to emit in the mid-IR, and JWST indeed indicates the presence of a mid-IR component with a column density high enough to generate strong absorption in the molecular bands, our hypothesis is that both observations trace the same continuum nuclear component (with Rh ≲ 27 pc as derived from ALMA). Additional support for this assumption is found in the CO 2-1 230 GHz rotational line profile displayed in Fig. D.1 (Lamperti et al. 2022), which shows an asymmetric profile with apparent blueshifted absorption between −500 and −350 km s−1 falling below the continuum. Assuming that this absorption is produced by the same gas responsible for the low-excitation H2O absorption found at similar velocities, the continuum behind both CO and H2O line absorption, at 1.3 mm and ∼6 μm, should arise from the same physical source. In the following, we explore and test this scenario further.
The high optical depth of the HC in the submm indicates that trapping of continuum photons will raise Td within the hot nucleus, and we have thus generated a grid of “greenhouse” models using the method described in gon19. AGN models are used here, together with an absorption coefficient of dust at < 10 μm similar to that obtained by Fritz et al. (2011) towards the galactic center, and an absolute calibration in terms of total hydrogen column density (NH, see Appendix C) consistent with the results by Planck Collaboration XXV (2011). In our continuum models, we include the absorption due to solid-phase silicates, but not due to ices or a:C-H, so that we aim to fit the envelope of the 2.6 − 8 μm continuum (see Fig. 2). For simplicity, flat density profiles are used.
The grid of greenhouse models for the HC covers log NH(cm−2) = 24.0 − 25.6 and unattenuated luminosities log Lunatt(L⊙) = 11.0 − 12.6, both with logarithmic steps of 0.21. A set of mid-IR 2.6 − 11 μm continuum points unaffected by ice, a:C-H, or gas-phase bands, together with the flux density at 667 μm of the HC, is used to find the best-fit model. The unattenuated nuclear emission is extinguished by a layer of foreground cold dust, which is required because the predicted silicate absorption at 9.7 μm generated by any relevant greenhouse model is found to be much shallower than the observed feature. The fitted parameters are, in addition to the properties of the greenhouse model (NH and Lunatt), its radius Rh and the optical depth of the foreground layer evaluated at 6 μm,  . Our best-fit model for the HC, with parameters listed in Table 2, is shown with a solid-blue line in Fig. 2; the dashed-blue line indicates the unattenuated emission (i.e., the emission that would be observed without the foreground layer).
Once the best fit model for the HC is obtained, the WC is fitted by using JWST continuum points at 11.5 − 26 μm, together with the flux density at 667 μm of the resolved component. A graybody (single-Td) extincted by the same foreground layer as for the HC (i.e., with the same  ) is adopted. We add to this graybody an extincted blackbody at 230 K, primarily contributing at < 10 μm, which has the effect of producing a better match to the H2O band (see Section 3.2). The fitted parameters for the WC are Td, the intrinsic optical depth evaluated at 6 μm (
 ), and the source radius Rw. The resulting “warm” continuum, with Td = 123 K, is complemented by a “hidden” component (discussed in Section 3.2) and shown in light-blue in Fig. 2. The fitted parameters are listed in Table 2. Finally, a graybody “cold” (Td = 45 K) component (CC) is added to the model to account for the remaining far-IR emission that cannot be explained with the HC and WC (orange curve in Fig. 2). The CC also includes the fraction of the 667 μm emission that is filtered out by ALMA.
The fit to the SED of IRAS 07251−0248 E indicates that the mid-IR (< 10 μm) continuum envelope and the 667 μm unresolved emission can indeed be matched with a single foreground-extincted nuclear component with unattenuated luminosity Lunatt ≈ 1012 L⊙. The sizes obtained for this HC (Rh = 13.2 pc) and for the WC (Rw = 71 pc) are consistent with the ALMA 667 μm measurements for the unresolved and resolved components. Our dust-to-gas mass ratio calibration (Appendix C) yields a gas mass (MH2 in Table 2) dominated by the CC. The total MH2 = 5.3 × 10⁹ M⊙ is comparable with the value obtained from CO 1 − 0 (4.3 × 10⁹ M⊙, González-Alfonso et al. 2015) and CO 2 − 1 (5.0 × 10⁹ M⊙, Lamperti et al. 2022), while the CO 2 − 1 value for the central (r < 250 pc) region is consistently lower (2.5 × 10⁹ M⊙, Pereira-Santaella et al. 2021). The inserts in Fig. 2 indicate extreme mid-IR optical depths for the HC and also for the WC, as well as hot dust (> 500 K) within the bulk of the HC. Nevertheless, the surface temperature of the HC is much more moderate (≈200 − 250 K), owing to the nearly complete conversion of the luminosity into blackbody emission from the nuclear photosphere (Td ≈ (Lunatt/(4πRh2σSB))1/4 = 240 K).
3.2. The 6 μm photosphere traced by the H2O ν2 = 1 − 0 band
The nuclear HC, with extreme column densities and accounting for the bulk of the mid-IR < 8 μm continuum, naturally generates strong mid-IR absorption in the gas-phase molecular bands. If the H2O excitation is due to radiative pumping, the H2O ν2 = 1 − 0 band is key to check whether the inferred Td profile can reproduce the observed line ratios and also provides valuable information on the gas-phase H2O abundance and the kinematics of the nuclear region.
Using the Td profile obtained from our best-fit continuum model for the HC (Fig. 2), we have generated a grid of non-LTE, non-local radiative transfer models for H2O (e.g., González-Alfonso et al. 2024) by varying only the H2O abundance relative to H2 (XH2O, assumed uniform) and the gas velocity field. Dust and gas are uniformly mixed within the nucleus, and due to the extreme nuclear mid-IR extinction only the 6 μm photosphere can be traced with the H2O ν2 = 1 − 0 band. With the redshift obtained from emission lines (z = 0.08778, Speranza et al. 2025, see also Fig. D.1), we interpret the blueshift of the H2O lines as an expansion of the nuclear surface and apply across the nuclear photosphere an outflow velocity increasing linearly from 75 to 170 km s−1. Absorption at higher velocities (up to ∼ − 500 km s−1) is also observed in low-excitation lines (Section 2.2), and thus an additional H2O shell flowing with velocities of 150 − 400 km s−1 was placed in front of the nucleus.
Due to the strong absorption associated with H2O ice around 6 μm and a:C-H grains at 6.85 μm, the model predictions are better compared with the continuum-normalized spectrum in Figs. 3b,d. However, the models that give a good match to most lines systematically overestimate the absorption lines located close to the absorption troughs, particularly at 6.85 μm. This specific model departure indicates the presence of an additional mid-IR component, unaffected by ice-mantle and H2O absorption, that dilutes the H2O line absorption at wavelengths where its strength is comparable to the observed continuum. Specifically, the flux density at frequency ν can be written as
 (2)
(2)
where FνHC and  are the (attenuated) flux densities from the HC and all other components i (including the additional mid-IR component), and fν, normH2O is the continuum-normalized H2O absorption predicted by our model for the HC. Since the observed continuum
  has the same expression as Eq. (2) but excluding the fν, normH2O factor, the continuum-normalized spectrum is given by
 (3)
(3)
where we have defined a λ−dependent covering factor for the HC, which is the fractional contribution by the HC to the observed continuum:
 (4)
(4)
We use Eqs. (3) and (4) to compare the H2O models with the observed continuum-normalized spectrum in Figs. 3b,d. At wavelengths where fhot becomes significantly lower than unity, because the HC continuum is severely attenuated by ice or a:C-H and thus the expected  from any other component i becomes comparable to
  , the continuum normalized absorption due to any H2O line in front of the HC will be reduced according to Eq. (3). The 123 K component for the WC in Table 2 yields negligible emission below 10 μm, and we find that a blackbody of 230 K, attenuated in the same way as the HC and WC (green dotted-dashed curve in Fig. 2), is required to successfully correct the mentioned discrepancies. This 230 K component does not dominate the continuum emission at any wavelength, so we denote it as the “hidden” component. Although its origin is uncertain, we tentatively associate it with the WC (and add it to the WC; light-blue curve in Fig. 2). In Figs. 3b,d, fhot is shown as black dashed lines.
Our best-fit model for the H2O band (Figs. 3b,d) is obtained for XH2O = 8 × 10⁻⁵ within the nucleus and NH2O ≈ 1.6 × 1018 cm−2 for the surrounding H2O shell. A more detailed comparison between the observed line profiles and model predictions is shown in Fig. D.2 and discussed in Appendix D, but here we emphasize the following points: first, that ground-vibrational levels of H2O are excited through the pumping of the ν2 = 1 state by the strong mid-IR radiation that bathes the nuclear region and its surroundings. Second, the high XH2O ∼ 10−4 is in line with chemical models of hot regions where H2O ice has been vaporized and nearly all gas-phase oxygen not locked into CO is converted into H2O (e.g., Nomura & Millar 2004), as well as with models of C-type shocks (Kaufman & Neufeld 1996). Third, despite very high Td within the bulk of the HC, the model captures the observed moderate H2O excitation due to the moderate Td values of the nuclear photosphere (lower insert in Fig. 2), which is the only region the absorption band can probe due to extinction. We show in Appendix F that the HCN, C2H2, CH4, and CO2 bands are also reproduced with our model.
4. Discussion and conclusions
The schematic illustration of the model source shown in Fig. 4 reflects the structure inferred from the observations of IRAS 07251−0248 E and the model: the expanding nuclear region (HC), is surrounded by outflowing gas (the high velocity foreground shell seen in H2O), and a nearly face-on torus (WC). The HC and the WC are both embedded in an envelope representing the CC, which dominates the far-IR emission between 50 and 300 μm. In our illustration, the CC lies in front of the HC and WC, and thus the CC also represents the foreground layer that extinguishes the continuum emission from the HC and the WC and is responsible for the 9.7 and 18 μm silicate absorption. The alternative, that the WC is a spherical shell surrounding the HC, as Fig. 1 might suggest, and is thus responsible for the foreground extinction of the HC, is slightly disfavored because the high optical depth of the WC (right insert in Fig. 2) would totally extinguish the mid-IR continuum emission from the HC. Nevertheless, it is still possible that the high-velocity outflow has cleared the path to the HC along the line of sight and the extinction is caused by the residual material of the WC or by the outflowing material. The CC should include the far-IR emission from the western galaxy of the merger, with 9% contribution to the overall luminosity (∼2.5 × 10¹¹ L⊙, Pereira-Santaella et al. 2021). Regardless of the origin of the foreground extinction layer, it will probably have spatially varying chemical properties, since it is fed by outflowing material from the direction of the nucleus, generating the observed H2O ice and a:C-H absorption as the gas-phase H2O freezes out and the hydrocarbons attach to carbonaceous grains (García-Bernete et al. 2025b).
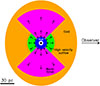 |
Fig. 4. Schematic representation of the model source. The extremely compact and expanding core (HC) is shown in blue (the 6 μm photosphere is its external surface), with gas flowing outward (the surrounding shell outflowing at ∼ − 400 km s−1) in green. The starburst torus shown in magenta represents the WC. The torus also appears to be expanding, because the far-IR lines are blueshifted (Appendix E, Fig. E.1). Both the HC and WC are embedded in an extended cold component (CC), in orange. The model is axisymmetric about the line of sight. |
The WC is a very optically thick structure (right insert in Fig. 2) surrounding the compact nucleus. Its far-IR emission is much stronger than the HC due to its larger size, which is similar to the size of the warm and optically thick regions that in other ULIRGs generate the far-IR absorption in rotational lines of OH, H2O, and other molecular species (e.g., Arp 220 and Mrk 231; González-Alfonso et al. 2012, 2014). The far-IR continuum emission from these regions is usually diluted within the emission from colder regions that also contribute to the far-IR, which is the reason why (together with re-emission in the line) the far-IR optically thick lines absorb only a fraction (≲20%) of the total continuum (González-Alfonso et al. 2015). A similar situation applies to IRAS 07251−0248, as the CC dominates the far-IR and the continuum from the WC should be diluted (Fig 2). The Herschel/PACS spectra around the wavelengths of the OH doublets at 119, 79, and 65 μm, shown in Fig. E.1, exhibit optically thick absorption in the OH doublets and also in lines of H2O, CH+, and CH, so that their absorption strengths are sensitive to the fractional contribution of the WC to the far-IR. We show in Appendix E a model for these lines that reasonably fits the absorption troughs, indicating that the modeled 65 − 120 μm continuum level generated by the WC is consistent with the available far-IR spectroscopic data. All far-IR lines are blueshifted by ∼150 km s−1 (Fig. E.1), indicating that the WC is also expanding.
4.1. Uncertainties in the inferred parameters
The extreme NH2 and MH2 inferred in the HC (Table 2) could still be lower limits, because the adopted inner radius of the source is 0.15 × Rout, enabling high Td > 1000 K for r < 8 pc (left insert in Fig. 2). However, if the dust is concentrated in a thinner shell close to the photosphere, as suggested by the outflow observed in the mid-IR molecular bands, or if the greenhouse effect in our models overestimates the actual Td values (see discussion in gon19), both NH2 and MH2 would increase because of the overall lower Td.
As shown in Table 2, the apparent luminosities (Latt) of the three components yield a total output power of 2.3 × 10¹² L⊙, but the combined unattenuated luminosities (Lunatt) obviously give a higher value. This indicates that the values of Lunatt are, for both the WC and the CC, in part re-emission from more inner components, i.e., they are not only due to the power sources located within their physical regions (e.g., González-Alfonso et al. 2004). The WC surrounds the HC and part of its emission will be an effect of the HC illumination. Similarly, if the CC surrounds both the WC and the HC, a fraction of its emission will be an effect of heating by the innermost components. Defining the “intrinsic luminosity” Lint of a component as the unattenuated luminosity generated by only the power sources within the physical region, and under the assumption that isotropic emission is applicable to the optically thick HC and WC components, the values of Lint would be 1012, ∼1012, and ∼3 × 10¹¹ L⊙ for the HC, WC, and CC, respectively. These estimates also assume that nearly the entire luminosity from the HC is absorbed and re-emitted by the WC, which would then intrinsically generate only half of its Lunatt value; the CC would then produce the remaining emission that accounts for the total output power, including the emission from the western galaxy.
Nevertheless, isotropic emission must not necessarily apply to the optically thick HC and/or WC components, in which case their Lint will depart from the isotropic values quoted above (see Efstathiou et al. 2014, 2022). If the morphology of the WC was a flat disk seen nearly face-on, Lunatt(WC) = 2πRW2σSBTd4 ∼ 1012 L⊙ for RW = 71 pc and Td = 123 K (Table 2). The actual scenario is most likely intermediate between the spherical and flat morphologies (Fig. 4). Similarly, if the HC has a structure elongated along the line of sight, its Lint would exceed 1012 L⊙, and the WC emission would be predominantly attributable to external heating. This possibility is supported by the fact that, rather than representing a separate physical structure, the WC appears to be connected to the HC, since both exhibit high column densities and similar kinematics (Appendix E) although quite different brightnesses. In Table 2 we provide plausible ranges for Lint, taking these uncertainties into consideration.
4.2. A CON hiding a quasar, surrounded by a starburst
From a comparative perspective, the high brightness of the HC favors a dominant AGN contribution to the luminosity. The luminosity surface density, Σbol ≈ 4.6 × 10⁸ L⊙ pc−2, is ∼1 dex higher than the values found in other CONs with comparable sizes and gas mass surface densities (ΣH2 ≈ 5 × 10⁵ M⊙ pc−2), such as NGC 4418 ((3 − 7)×107 L⊙ pc−2, Sakamoto et al. 2013; González-Alfonso et al. 2012), IC 860 ((1 − 8)×107 L⊙ pc−2, Aalto et al. 2019; gon19) or Arp 220 W (∼3 × 10⁷ L⊙ pc−2, gon19)2. Our model for the HC yields an unattenuated SED that peaks in the mid-IR (Fig. 2), while the continuum models in gon19 consider lower values of Σbol and the corresponding SEDs peak in the far-IR.
Nevertheless, the enormous accumulation of gas in the HC requires consideration of the role of a potential transitory burst of star formation. We first note that the H2O absorption line shapes do not show any distinct feature at central velocities (Figs. D.1 and D.2), meaning that the whole mid-IR photosphere of the HC is outflowing and suggesting the entire expulsion of gas from the nuclear region. If responsible for the outflowing gas, a nuclear starburst could not have a duration much longer than the outflow dynamical timescale of tdyn ∼ Rh/v = 8 × 10⁴ yr, and, indeed, the free-fall time, tff = (3π/32Gρ)1/2 = 4.1 × 10⁴ yr (calculated from the averaged nH2 = 5.8 × 105 cm−3), accomplishes this constraint. However, with these short timescales a pure starburst scenario would imply that most stars are actually in the protostar phase with the luminosity arising from gas accretion, while expelling the inflowing material that feeds them.
Thompson et al. (2005) argued that for an optically thick starburst disk radiating at its Eddington limit for dust, a characteristic maximum Σbol ∼ 107 L⊙ pc−2 is attained that is independent of Σgas (≈1.36 × ΣH2). This limit for Σbol falls too short to explain the inferred value in the HC, and an AGN would then be responsible for the bulk of the luminosity. Andrews & Thompson (2011) postulated the possibility of hot starbursts with extreme values of Σbol ∼ 5 × 10⁸ L⊙ pc−2 for Σgas ∼ 5 × 10⁵ M⊙ pc−2, but attributed them to the parsec-scale region fueling a bright AGN.
More recently, Grudić et al. (2018) proposed that for sufficiently high ΣH2 > Σcrit ∼ 3 × 10³ M⊙ pc−2, feedback fails due to the strong gravitational force and an extraordinary burst of star formation converts most of the gas into stars within a few tff. The key feature of these models is that the momentum deposition per stellar mass is assumed to be independent of environment; that is, the “τIR boost” characteristic of radiation pressure in optically thick components is neglected owing to presumable leakage of photons along optically thin paths. We note that the maximum Σgas ∼ 1.3 × 10⁴ M⊙ pc−2 considered in their simulations is ∼40× lower than the value of the HC, but here we assume that their results can be extrapolated to our more extreme conditions. Adopting a zero-age main sequence (ZAMS) population with 3 × 10³ erg s−1 g−1, a stellar mass of M* = 6.3 × 10⁸ M⊙ is required to account for 1012 L⊙. The current star-formation efficiency would then be SFE = M*/(M* + Mgas)∼0.63 and, with a formation timescale of ∼2 tff, the star-formation rate would be SFR ∼ 7.7 × 10³ M⊙ yr−1 with a per-freefall SFE of ϵff ∼ 0.6. Within the uncertainties, the values of SFE and ϵff agree with the results of Grudić et al. (2018) simulations.
Nevertheless, the above pure-starburst scenario faces serious drawbacks in the case of the HC in IRAS 07251−0248. First, the implied values of Σ* ∼ 106 M⊙ pc−2 are found in a few very dense nuclear star clusters (NSCs), but on smaller spatial scales (≲5 pc) and with lower M* (Grudić et al. 2019; Neumayer et al. 2020). Second, the concentration of the observed gas mass in the HC would be hard to explain with such a burst of star formation, because accretion of ∼109 M⊙ onto a volume with radius Rh ∼ 13 pc would also have to be achieved within ∼1 tff (see also Grudić et al. 2019), requiring unrealistic accretion rates. Third, protostars do not efficiently generate the cosmic rays (CRs) required to explain the observed H3+, CR-dominated chemistry, and carbonaceous grain erosion in the HC (Pereira-Santaella et al. 2024; Speranza et al. 2025; García-Bernete et al. 2025b). Fourth, the H2O line profiles strongly suggest a collective motion of the whole nuclear gas that is better explained by a single feedback event rather than by the effect of many individual protostars. Finally, the “greenhouse effect” required to explain the high submm brightness of the HC translates into the “τIR boost”, which cannot be neglected for the extreme Σgas in the HC, and the observed feedback would be hard to explain without this effect.
Conversely, an AGN burst responsible for the observed luminosity and feedback would have enabled smoother gas accretion onto the nuclear region, owing to the different spatial scales and solid angles of AGN feedback and nuclear gas accretion, and the stochastic nature of the former. While the previous formation of an NSC in IRAS 07251−0248 E is a natural outcome of the highly concentrated ISM, the extreme Σbol strongly suggests a limited star-formation efficiency within a compact obscured nucleus (CON) that is powered by an AGN currently emitting at quasar level, in agreement with Pereira-Santaella et al. (2021).
With uncertainties related to geometry in optically thick sources, it appears that the WC is forming stars at high rates equivalent to at least ∼5 × 10¹¹ L⊙, supporting the view of the composite nature of ULIRGs (e.g., Veilleux et al. 2009) with the specificity that the WC is a nuclear starburst characterized by high column densities. The high gas mass accumulation at the center of the galaxy both drives a starburst in situ, and thus the formation of an NSC, and efficiently feeds the central supermassive black hole (Neumayer et al. 2020), exemplifying the black hole and star formation co-evolution in its most extreme form. The transition from star formation to black hole accretion in the HC may be smooth under these conditions, and tidal disruption and capture of (proto)stars close to the black hole may be an efficient black hole growth channel (Strubbe & Quataert 2009).
4.3. Outflow energetics: a hot bubble driving the HC expansion?
With the values of MH2 and R from Table 2 and a velocity of 160 km s−1, the mass outflow rate associated with the HC is estimated as Ṁ = μ MH2 v/R = 2.9 × 10³ M⊙ yr−1, where μ = 1.36 corrects for species other than hydrogen. Here we have assumed that the entire nuclear source is expanding, although we can only probe the kinematics of its mid-IR photosphere. The momentum rate is then Ṗ = Ṁv = 2.7 × 1036 dyn = 21.5LAGN/c and the energy flux is Ė = 0.5 Ṁv2 = 2.05 × 1043 erg s−1 = 5.4 × 10⁻³ LAGN, where we have adopted LAGN = 1012 L⊙ (Table 2).
Radiation pressure on dust grains could, in principle, drive the observed outflow if it can overcome the opposite effect of (self-)gravitation on the gas (e.g., Ishibashi & Fabian 2015). Taking into account the backpressure effects in optically thick environments gon19 and with a gas mass of μ MH2 = 3 × 10⁸ M⊙ within the HC (Table 2), the gravitational force would, however, balance the force due to radiation pressure at the HC surface as long as the combined black hole and stellar mass attains ∼2.5 × 10⁸ M⊙. This is plausible, and thus the effect of radiation pressure in driving the outflow is uncertain.
Another possibility consists of an inner hot bubble inflating the nucleus such that molecular outflow is generated as the bubble sweeps up the concentrated nuclear gas. We have explored this point using the analytic self-similar solutions developed by Faucher-Giguère & Quataert (2012) (their Appendix A), assuming that the hot shocked wind conserves energy. We first constrain the swept-out gas mass to μ MH2 = 3 × 10⁸ M⊙ at 13.2 pc with a flat density profile, and assumed that 1/2 of the mechanical energy injected by the AGN (vwind LAGN/2c, where vwind is the inner wind velocity and LAGN = 1012 L⊙) goes into kinetic motion of the swept-up gas. Then, for vwind = 2 × 10⁴ km s−1, a shock velocity driven into the ambient gas of 170 km s−1 at 13.2 pc is obtained, in agreement with the blueshift of the peak absorption observed in the molecular lines. However, the flow time of ∼5 × 10⁴ yr is about half the proton cooling time calculated using the two-temperature effects derived from thermal uncoupling of e− and protons (Faucher-Giguère & Quataert 2012), and thus a partially energy-conserving phase is not ruled out.
This hot bubble scenario is an ultracompact version of the (partially) energy-conserving phase of outflows driven by AGN (Tombesi et al. 2015; Feruglio et al. 2015), with much lower shock velocities that are a consequence of the enormous gas masses that are being swept-up at small radii. The bulk of the gas will not escape from the potential well of the galaxy, and thus a series of CON phases are expected to occur over longer timescales, while holes in the structure will be increasingly opened, generating in later times more extended and faster OH and CO outflows. The interesting feature of the proposed hot bubble scenario is that the inner wind shock presumably accelerates cosmic-ray particles (e.g., Zubovas & King 2012), a key ingredient of the strong H3+ absorption (Pereira-Santaella et al. 2024) and unique carbon-rich (García-Bernete et al. 2025b) and molecular cation (Speranza et al. 2025) chemistry observed in IRAS 07251−0248 E. The strength of linking kinematics and chemistry may favor this scenario over radiation pressure as the origin of the observed outflow.
Acknowledgments
We thank the referee for the constructive comments that helped improve the clarity of the manuscript, and acknowledge the DD-ERS teams for developing their observing program with a zero–exclusive–access period. EG-A thanks the Spanish MICINN for support under projects PID2022-137779OB-C41 and PID2023-146667NB-I00. MPS acknowledges support under grants RYC2021-033094-I, CNS2023-145506 and PID2023-146667NB-I00 funded by MCIN/AEI/10.13039/501100011033 and the European Union NextGenerationEU/PRTR. IGB is supported by the Programa Atracción de Talento Investigador “César Nombela” via grant 2023-T1/TEC-29030 funded by the Community of Madrid. This work is based on observations made with the NASA/ESA/CSA James Webb Space Telescope. The data were obtained from the Mikulski Archive for Space Telescopes at the Space Telescope Science Institute, which is operated by the Association of Universities for Research in Astronomy, Inc., under NASA contract NAS 5-03127 for JWST; and from the European JWST archive (eJWST) operated by the ESAC Science Data Centre (ESDC) of the European Space Agency. These observations are associated with program #3368. This paper makes use of the following ALMA data: ADS/JAO.ALMA#2023.1.00942.S. ALMA is a partnership of ESO (representing its member states), NSF (USA) and NINS (Japan), together with NRC (Canada) and NSC and ASIAA (Taiwan) and KASI (Republic of Korea), in cooperation with the Republic of Chile. The Joint ALMA Observatory is operated by ESO, AUI/NRAO and NAOJ.The National Radio Astronomy Observatory is a facility of the National Science Foundation operated under cooperative agreement by Associated Universities, Inc.
References
- Aalto, S., Martín, S., Costagliola, F., et al. 2015, A&A, 584, A42 [NASA ADS] [CrossRef] [EDP Sciences] [Google Scholar]
- Aalto, S., Muller, S., König, S., et al. 2019, A&A, 627, A147 [NASA ADS] [CrossRef] [EDP Sciences] [Google Scholar]
- Andrews, B. H., & Thompson, T. A. 2011, ApJ, 727, 97 [NASA ADS] [CrossRef] [Google Scholar]
- Böker, T., Arribas, S., Lützgendorf, N., et al. 2022, A&A, 661, A82 [NASA ADS] [CrossRef] [EDP Sciences] [Google Scholar]
- Buiten, V. A., van der Werf, P. P., Viti, S., et al. 2024, ApJ, 966, 166 [NASA ADS] [CrossRef] [Google Scholar]
- Buiten, V. A., van der Werf, P. P., Viti, S., et al. 2025, A&A, 699, A312 [Google Scholar]
- Chubb, K. L., Tennyson, J., & Yurchenko, S. N. 2020, MNRAS, 493, 1531 [NASA ADS] [CrossRef] [Google Scholar]
- Costagliola, F., Aalto, S., Rodriguez, M. I., et al. 2011, A&A, 528, A30 [NASA ADS] [CrossRef] [EDP Sciences] [Google Scholar]
- Davidson, S. A., Evenson, K. M., & Brown, J. M. 2001, ApJ, 546, 330 [CrossRef] [Google Scholar]
- Draine, B. T., & Lee, H. M. 1984, ApJ, 285, 89 [NASA ADS] [CrossRef] [Google Scholar]
- Efstathiou, A., Pearson, C., Farrah, D., et al. 2014, MNRAS, 437, L16 [Google Scholar]
- Efstathiou, A., Farrah, D., Afonso, J., et al. 2022, MNRAS, 512, 5183 [NASA ADS] [CrossRef] [Google Scholar]
- Ehrenfreund, P., Boogert, A. C. A., Gerakines, P. A., Tielens, A. G. G. M., & van Dishoeck, E. F. 1997, A&A, 328, 649 [NASA ADS] [Google Scholar]
- Falstad, N., Hallqvist, F., Aalto, S., et al. 2019, A&A, 623, A29 [NASA ADS] [CrossRef] [EDP Sciences] [Google Scholar]
- Falstad, N., Aalto, S., König, S., et al. 2021, A&A, 649, A105 [NASA ADS] [CrossRef] [EDP Sciences] [Google Scholar]
- Faucher-Giguère, C.-A., & Quataert, E. 2012, MNRAS, 425, 605 [Google Scholar]
- Feruglio, C., Fiore, F., Carniani, S., et al. 2015, A&A, 583, A99 [NASA ADS] [CrossRef] [EDP Sciences] [Google Scholar]
- Fritz, T. K., Gillessen, S., Dodds-Eden, K., et al. 2011, ApJ, 737, 73 [Google Scholar]
- García-Bernete, I., Rigopoulou, D., Aalto, S., et al. 2022a, A&A, 663, A46 [NASA ADS] [CrossRef] [EDP Sciences] [Google Scholar]
- García-Bernete, I., Rigopoulou, D., Alonso-Herrero, A., et al. 2022b, A&A, 666, L5 [NASA ADS] [CrossRef] [EDP Sciences] [Google Scholar]
- García-Bernete, I., Alonso-Herrero, A., Rigopoulou, D., et al. 2024a, A&A, 681, L7 [NASA ADS] [CrossRef] [EDP Sciences] [Google Scholar]
- García-Bernete, I., Pereira-Santaella, M., González-Alfonso, E., et al. 2024b, A&A, 682, L5 [NASA ADS] [CrossRef] [EDP Sciences] [Google Scholar]
- García-Bernete, I., Donnan, F. R., Rigopoulou, D., et al. 2025a, A&A, 696, A135 [NASA ADS] [CrossRef] [EDP Sciences] [Google Scholar]
- García-Bernete, I., Pereira-Santaella, M., González-Alfonso, E., et al. 2025b, Nat. Astron. [Google Scholar]
- González-Alfonso, E., & Sakamoto, K. 2019, ApJ, 882, 153 [Google Scholar]
- González-Alfonso, E., Smith, H. A., Fischer, J., & Cernicharo, J. 2004, ApJ, 613, 247 [Google Scholar]
- González-Alfonso, E., Fischer, J., Graciá-Carpio, J., et al. 2012, A&A, 541, A4 [NASA ADS] [CrossRef] [EDP Sciences] [Google Scholar]
- González-Alfonso, E., Fischer, J., Graciá-Carpio, J., et al. 2014, A&A, 561, A27 [NASA ADS] [CrossRef] [EDP Sciences] [Google Scholar]
- González-Alfonso, E., Fischer, J., Sturm, E., et al. 2015, ApJ, 800, 69 [CrossRef] [Google Scholar]
- González-Alfonso, E., García-Bernete, I., Pereira-Santaella, M., et al. 2024, A&A, 682, A182 [NASA ADS] [CrossRef] [EDP Sciences] [Google Scholar]
- Gordon, I. E., Rothman, L. S., Hargreaves, R. J., et al. 2022, J. Quant. Spectr. Rad. Transf., 277, 107949 [NASA ADS] [CrossRef] [Google Scholar]
- Grudić, M. Y., Hopkins, P. F., Faucher-Giguère, C.-A., et al. 2018, MNRAS, 475, 3511 [CrossRef] [Google Scholar]
- Grudić, M. Y., Hopkins, P. F., Quataert, E., & Murray, N. 2019, MNRAS, 483, 5548 [CrossRef] [Google Scholar]
- Imanishi, M., Nakanishi, K., Tamura, Y., & Peng, C.-H. 2009, AJ, 137, 3581 [Google Scholar]
- Ishibashi, W., & Fabian, A. C. 2015, MNRAS, 451, 93 [NASA ADS] [CrossRef] [Google Scholar]
- Iwasawa, K., Sanders, D. B., Teng, S. H., et al. 2011, A&A, 529, A106 [NASA ADS] [CrossRef] [EDP Sciences] [Google Scholar]
- Izumi, T., Kohno, K., Aalto, S., et al. 2016, ApJ, 818, 42 [NASA ADS] [CrossRef] [Google Scholar]
- Jakobsen, P., Ferruit, P., Alves de Oliveira, C., et al. 2022, A&A, 661, A80 [NASA ADS] [CrossRef] [EDP Sciences] [Google Scholar]
- Kaufman, M. J., & Neufeld, D. A. 1996, ApJ, 456, 611 [NASA ADS] [CrossRef] [Google Scholar]
- Krips, M., Neri, R., García-Burillo, S., et al. 2008, ApJ, 677, 262 [NASA ADS] [CrossRef] [Google Scholar]
- Labiano, A., Azzollini, R., Bailey, J., et al. 2016, SPIE Conf. Ser., 9910, 99102W [NASA ADS] [Google Scholar]
- Lamperti, I., Pereira-Santaella, M., Perna, M., et al. 2022, A&A, 668, A45 [NASA ADS] [CrossRef] [EDP Sciences] [Google Scholar]
- McMullin, J. P., Waters, B., Schiebel, D., Young, W., & Golap, K. 2007, ASP Conf. Ser., 376, 127 [Google Scholar]
- Müller, H. S. P., Thorwirth, S., Roth, D. A., & Winnewisser, G. 2001, A&A, 370, L49 [Google Scholar]
- Müller, H. S. P., Schlöder, F., Stutzki, J., & Winnewisser, G. 2005, J. Mol. Struct., 742, 215 [Google Scholar]
- Neumayer, N., Seth, A., & Böker, T. 2020, A&ARv, 28, 4 [Google Scholar]
- Nishimura, Y., Aalto, S., Gorski, M. D., et al. 2024, A&A, 686, A48 [NASA ADS] [CrossRef] [EDP Sciences] [Google Scholar]
- Nomura, H., & Millar, T. J. 2004, A&A, 414, 409 [CrossRef] [EDP Sciences] [Google Scholar]
- Pereira-Santaella, M., González-Alfonso, E., Usero, A., et al. 2017, A&A, 601, L3 [NASA ADS] [CrossRef] [EDP Sciences] [Google Scholar]
- Pereira-Santaella, M., Colina, L., García-Burillo, S., et al. 2021, A&A, 651, A42 [NASA ADS] [CrossRef] [EDP Sciences] [Google Scholar]
- Pereira-Santaella, M., Álvarez-Márquez, J., García-Bernete, I., et al. 2022, A&A, 665, L11 [NASA ADS] [CrossRef] [EDP Sciences] [Google Scholar]
- Pereira-Santaella, M., González-Alfonso, E., García-Bernete, I., et al. 2024, A&A, 689, L12 [NASA ADS] [CrossRef] [EDP Sciences] [Google Scholar]
- Pickett, H. M., Poynter, R. L., Cohen, E. A., et al. 1998, J. Quant. Spectr. Rad. Transf., 60, 883 [Google Scholar]
- Planck Collaboration XXV. 2011, A&A, 536, A25 [NASA ADS] [CrossRef] [EDP Sciences] [Google Scholar]
- Privon, G. C., Ricci, C., Aalto, S., et al. 2020, ApJ, 893, 149 [NASA ADS] [CrossRef] [Google Scholar]
- Ricci, C., Privon, G. C., Pfeifle, R. W., et al. 2021, MNRAS, 506, 5935 [NASA ADS] [CrossRef] [Google Scholar]
- Rieke, G. H., Wright, G. S., Böker, T., et al. 2015, PASP, 127, 584 [NASA ADS] [CrossRef] [Google Scholar]
- Rocha, W. R. M., Rachid, M. G., Olsthoorn, B., et al. 2022, A&A, 668, A63 [NASA ADS] [CrossRef] [EDP Sciences] [Google Scholar]
- Rosenthal, D., Bertoldi, F., & Drapatz, S. 2000, A&A, 356, 705 [NASA ADS] [Google Scholar]
- Sakamoto, K., Wang, J., Wiedner, M. C., et al. 2008, ApJ, 684, 957 [Google Scholar]
- Sakamoto, K., Aalto, S., Costagliola, F., et al. 2013, ApJ, 764, 42 [Google Scholar]
- Speranza, G., Pereira-Santaella, M., Agúndez, M., et al. 2025, MNRAS [Google Scholar]
- Spoon, H. W. W., Hernán-Caballero, A., Rupke, D., et al. 2022, ApJS, 259, 37 [NASA ADS] [CrossRef] [Google Scholar]
- Strubbe, L. E., & Quataert, E. 2009, MNRAS, 400, 2070 [NASA ADS] [CrossRef] [Google Scholar]
- Thompson, T. A., Quataert, E., & Murray, N. 2005, ApJ, 630, 167 [Google Scholar]
- Tombesi, F., Meléndez, M., Veilleux, S., et al. 2015, Nature, 519, 436 [NASA ADS] [CrossRef] [Google Scholar]
- Veilleux, S., Rupke, D. S. N., Kim, D. C., et al. 2009, ApJS, 182, 628 [NASA ADS] [CrossRef] [Google Scholar]
- Wells, M., Pel, J. W., Glasse, A., et al. 2015, The mid-infrared instrument for the James Webb Space Telescope, VI: The medium resolution spectrometer, Technical Report JWST-STScI-000006 [Google Scholar]
- Wright, G. S., Wright, D., Goodson, G. B., et al. 2015, PASP, 127, 595 [NASA ADS] [CrossRef] [Google Scholar]
- Yurchenko, S. N., Owens, A., Kefala, K., & Tennyson, J. 2024, MNRAS, 528, 3719 [CrossRef] [Google Scholar]
- Zubovas, K., & King, A. 2012, ApJ, 745, L34 [Google Scholar]
We use luminosities integrated from 3 to 1200 μm (basically total IR) because the nuclear component emits strongly below 10 μm, as seen below.
Here we define Σbol as Lbol/(4πR2), where R is the radius of the equivalent sphere, and modify the published values in case that Σbol is defined in a different way.
Appendix A: ALMA observations and models for the 667 μm continuum
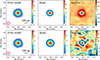 |
Fig. A.1. ALMA 667 μm continuum emission of IRAS 07251−0248 E and alternative models: a point source (upper) and a Gaussian (lower). Left: Observed emission, with colored scale in units of mJy/beam. Middle: Model. Right: Residuals in μJy/beam. These models give residuals much more prominent than our best point-source + Gaussian model fit in Fig. 1. |
We obtained high angular resolution ALMA observations of IRAS 07251−0248 E in Band 8 at ∼410 GHz (rest-frame ∼667μm; program 2023.1.00942.S, PI: M. Pereira-Santaella). Four 1.875 GHz bandwidth spectral windows with 10 km s−1 channels were defined for these observations. In this paper, we focus on the continuum detected after combining all the line-free channels in the spectral windows. We used the ALMA reduction software CASA (v6.5.4; McMullin et al. 2007) to calibrate and clean the data using the standard pipeline. For the cleaning, we applied the Briggs weighting with a robustness parameter of 1.0. To improve the quality of the continuum image, we applied a round of phase self-calibration using the emission from the bright H2O 448 GHz line (Pereira-Santaella et al. 2017). The final continuum image was corrected for the primary beam. The synthesized beam full-width half-maximum (FWHM) for the combined continuum image is 75×67 mas2 and the sensitivity is 0.20 mJy beam−1. For Band 8, the absolute flux accuracy is ∼20% (ALMA Technical Handbook).
Similarly to Pereira-Santaella et al. (2021), we modeled the continuum of IRAS 07251−0248 E to determine the flux, size, and position of the detected emission. Briefly, we used three simple models consisting of a point-source, a Gaussian, and a point-source + Gaussian (pG model). These models were convolved with the beam and their parameters varied to minimize the χ2 obtained from the comparison with the observed image. Figure A.1 shows the results of the fit for the point-source and Gaussian model, which both show significant residual structures indicating that they fail to reproduce the nuclear emission of this object. Instead, the fit is much better for the pG model, which shows no evident residuals (Fig. 1).
Appendix B: JWST observations and data reduction
The JWST observations of IRAS 07251−0248 E have been described in detail by García-Bernete et al. (2025b) and Speranza et al. (2025). Data were taken with the integral-field spectrograph NIRSpec, using the grating filter pair G395H (2.9 − 5.3 μm with resolution R ∼ 2700; Jakobsen et al. 2022; Böker et al. 2022), and MIRI MRS (4.9 − 28.1 μm, R ∼ 3700 − 1300; Rieke et al. 2015; Wells et al. 2015; Wright et al. 2015). The data were reduced following the standard MRS pipeline procedure (Labiano et al. 2016), additionally using extra steps to identify and correct hot and cold pixels (Pereira-Santaella et al. 2024; García-Bernete et al. 2024a). The spectrum was extracted according to the method described in Pereira-Santaella et al. (2022) and García-Bernete et al. (2022b, 2024a,b).
Appendix C: The absorption coefficient of dust
Our adopted 6 μm-normalized absorption coefficient of dust from mid-IR to submm wavelengths is shown in Fig. C.1 and compared with the mid-IR values inferred towards the Galactic Center (GC) by Fritz et al. (2011). The latter includes mid-IR features due to ices and aliphatic hydrocarbons that we have ignored, but otherwise our curve fits the overall GC curve for λ < 10 μm. However, we have modified the GC curve for λ = 10 − 20 μm according to Rosenthal et al. (2000), which is in turn based on the work of Draine & Lee (1984). This modification gives a better fit to the IRAS 07251−0248 spectrum at the quoted wavelengths. At λ > 20 μm, we use an emissivity index similar to that of the GC curve (β = 1.85) all the way to millimeter wavelengths.
Planck Collaboration XXV (2011) have given an absolute calibration of τ250μm/NH = 2.32 × 10⁻²⁵ cm2, which for β = 1.85 yields μ × DGR × k670μm = 2.2 × 10⁻² cm2 g−1, where DGR is the dust-to-gas ratio by mass and μ = 1.36 corrects for all species other than hydrogen. We have adopted this calibration to calculate the H2 masses in Table 2, which roughly agree with independent methods based on CO emission (Section 3.1). This indicates a suitable calibration for at least the CC component that dominates the gas mass budget, but the results are more uncertain for the WC and mostly for the HC. At 6 μm we obtain τ6μm/NH = 1.3 × 10⁻²³ cm2, which is used to calculate the molecular abundances in our models where dust and molecules are evenly mixed. The hydrogen column density in terms of the optical depth at 667 μm is NH = 2.6 × 1025 τ667μm cm−2.
Appendix D: Details of the H2O band
Figure D.1 clearly illustrates the blueshift of the H2O ν2 absorption lines relative to several emission lines detected with MIRI/MRS. (Note that the absorption features close to some emission lines are due to R branch lines of the also blueshifted HCN 2ν2 band.) The CO 2-1 rotational line (see also Fig. C.1 in Lamperti et al. 2022) shows an asymmetric shape with the blueshifted part of the profile weaker than the redshifted part. In view of the absorption of the continuum detected in the velocity range [−570,−350] km s−1, the asymmetry of the line core is also attributable to the absorption of the continuum by the outflowing approaching CO gas, most likely on spatial scales of the WC. In the lower two panels of Fig. D.1, the profiles correspond to low-excitation H2O lines that also display absorption up to ∼ − 600 km s−1; other more excited lines do not show this high-velocity absorption (Fig. D.2).
A detailed comparison between a number of observed H2O line shapes and the best-fit model predictions is presented in Fig. D.2. As shown in the inserted energy level diagram, the displayed lines (mostly within the R branch) span a broad range of level excitation in the ground vibrational state, from the ground ortho level (10, 1) to the 101, 10 one at ∼1600 K, including both backbone and non-backbone levels.
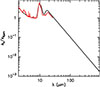 |
Fig. D.1. Adopted absorption coefficient of dust normalized at 6 μm (black), compared to the mid-IR values obtained by Fritz et al. (2011) toward the Galactic Center (red). |
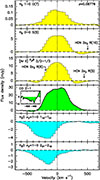 |
Fig. D.2. Line profiles of some emission lines as compared with two low-excitation H2O ν2 = 1 − 0 absorption lines. The velocity scale on the abscissa is calculated with a redshift of z = 0.08778. All mid-IR molecular absorption lines have peak absorption blueshifted by 100 − 200 km s−1 relative to the peak emission lines, as exemplified by the H2O lines. Note that the rotational CO 2-1 line shows absorption below the continuum at velocities from −350 to −570 km s−1 as highlighted in the insert, consistent with the H2O wing absorption at similar velocities. |
As described in Section 3.2, we include two H2O components along the line of sight to the mid-IR continuum from the HC: one is evenly mixed with the hot dust responsible for this continuum, with velocities between 75 and 170 km s−1, and the other is a broad layer extending from the HC photosphere outwards with velocities between 150 and 400 km s−1. In combination with a turbulent velocity of 90 km s−1, this velocity field can approximately match the observed profiles. Radiative pumping fully dominates the excitation of the first component, so that the H2 density used in the models (nH2 = NH2/(Rh − Rint)∼6 × 105 cm−3) has no impact on the results as long as the H2O abundance relative to the dust remains unchanged. The foreground layer is used to account for the low-excitation absorption at the highest velocities, and is shown to produce significant absorption up to the 50, 5 − 41, 4 line (Elow ≈ 300 K). In higher excitation lines, the blueshifted absorption is restricted to velocities > − 300 km s−1 (e.g., 71, 6 − 62, 5). Because of the strong nuclear mid-IR radiation field, the excitation of this layer component is also dominated by radiative pumping.
Despite the large column densities of H2O mixed with the dust in the HC, the predicted absorption troughs are still sensitive to the H2O abundance relative to the dust, mostly in the highest excitation lines. This is because the dust opacity restricts the H2O that can generate absorption to the external layers of the source (i.e., to τ6μm ≲ 1.5 from the surface), and N(H2O)∼5 × 1018 cm−2 in this shell is much lower than the total value. Our best-fit H2O abundance relative to H2 of 8 × 10⁻⁵ is similar to the value inferred by García-Bernete et al. (2025b).
The profiles displayed in Fig. D.2 show that our best fit model overpredicts the absorption in the low excitation 11, 0 − 10, 1 and 10, 1 − 11, 0 lines. The discrepancy is attributable to potential resonant scattering of the mid-IR continuum over larger scales, as H2O is also present in the WC (Appendix E). The model also overpredicts the absorption in some high excitation lines (90, 9 − 81, 8, 101, 10 − 90, 9, 91, 8 − 82, 7, 73, 5 − 62, 4), but accounts rather well for the rest of the lines.
Appendix E: The far-IR molecular absorption
Molecular abundances relative to H nuclei in the WC of IRAS 07251−0248 E
Due to the dilution of the WC + HC far-IR continuum discussed in Section 4, we show in Fig. E.1 the continuum-subtracted far-IR spectra observed with Herschel/PACS around the wavelengths of the OH 119, 79, and 65 μm doublets. If the far-IR continuum level predicted by our model for the WC is correct, we will be able to match the observed absorption troughs in this absolute scale.
The far-IR absorption features shown in Fig. E.1 are characteristic of very optically thick regions. In panel a, the ground-state OH 119 μm doublet exhibits a flat profile with no dip in the absorption between the two l−doubling components. We also find clear detection of the red component of 18OH 120.15 μm, as well as strong absorption due to CH+ 3-2 at 119.8 μm and to the CH (N = 3, J = 7/2)−(2, 5/2) doublet around 118.5 μm (Elow ≈ 100 K; for a level diagram of CH see Davidson et al. 2001). To our knowledge, this is the only ULIRG where the CH+ 3-2 absorption is nearly as strong as that due to OH 119 μm. In panel b, two H2O lines (42, 3 − 31, 2 and 61, 5 − 52, 4 at 78.7-78.9 μm) are detected, together with a broad feature that is in part due to the ground-state OH 79 μm doublet but requires additional absorption at velocities more blueshifted than −350 km s−1 from OH. In panel c, strong absorption in the OH 65 μm doublet (Elow ≈ 300 K) is seen, which has the second highest equivalent width among all galaxies observed with Herschel/PACS (González-Alfonso et al. 2015). 18OH at 65.6 μm is also detected. As indicated in Fig. E.1 for the OH lines, all features are blueshifted by ∼150 km s−1.
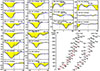 |
Fig. E.1. H2O ν2 = 1 − 0 line profiles in IRAS 07251−0248 observed with JWST MIRI/MRS. Filled histograms are the observed profiles and blue lines are model results. Abscissa represents velocity (in km s−1) and ordinate is continuum-normalized. All detected lines have a peak absorption that is blueshifted by 100 − 200 km s−1. The selected transitions are R or Q branch lines that are not extremely blended and cover a representative range of level energies. Note that some displayed lines are not detected (right column). The energy level diagram corresponds to the ground state, with levels involved in the displayed profiles shown in red. |
Our model for the far-IR lines includes the quoted species (OH, 18OH, H2O, CH, CH+) together with H2O+, which has several rotational lines in these spectral regions. Spectroscopic data used for OH, CH, CH+, and H2O+ were obtained from the JPL (Pickett et al. 1998) and CDMS (Müller et al. 2001, 2005) catalogs. Since the WC is very optically thick (τ100μm ≈ 10, Fig. 2), warm (Td = 123 K, Table 2), and has a size (Rw = 71 pc) larger than the HC, it dominates the absorption in the observed lines. The inferred abundances are listed in Table E.1. An OH abundance of ≈5 × 10⁻⁶, similar to the value found in the nuclear region of NGC 4418 (with similar Td, González-Alfonso et al. 2012) is required to generate absorption troughs in the OH 119 and 65 μm doublets comparable to the observed features (light-blue curves in Fig. E.1). However, the observed very broad OH 79 μm feature is still underpredicted with just the WC, and we have thus included in the model the expected OH contribution from the HC, as well as a model for H2O+ in both components. The 79.1 μm absorption is then better reproduced, although its unpredicted blueshifted shoulder at 79.0 μm suggests that an additional unidentified species further contributes to the absorption. With a similar abundance of ≈5 × 10⁻⁶ in the WC, the H2O lines are matched as well, thus indicating a decline of its abundance of ∼1 dex from the compact HC to the more extended WC. We also note the high abundances inferred for both CH and CH+, suggesting that the hydrocarbon-rich chemistry observed in the mid-IR towards the nuclear region (García-Bernete et al. 2025b) applies to some extent to the WC.
In summary, the reasonable match to the far-IR absorption lines indicates that the continuum level of the WC in the far-IR predicted by our model is accurate within ∼20%. The similar kinematics found for the far-IR and mid-IR absorption lines and the high abundances found for CH and CH+ indicate that the physical and chemical processes in the WC are also affected by the AGN at the core of the HC.
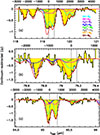 |
Fig. E.2. Herschel/PACS continuum-subtracted spectra of IRAS 07251−0248 around 119, 79, and 65 μm (filled histograms), and model fit. The upper scale in each panel is velocity in km s−1 relative to the blue component of each OH doublet, and the two vertical dotted lines indicate the positions of the two OH l−doubling components (rest wavelengths are calculated for a redshift z = 0.08778). The contribution to the modeled spectrum by different species and components is shown with different colors as labeled in panel (a); red is total. |
Appendix F: The HCN, C2H2, CH4, and CO2 bands
The JWST MIRI/MRS spectrum of IRAS 07251−0248 at 6.8 − 8.0 μm in Fig. F.1a shows a forest of absorption lines that are identified with the gas-phase HCN 2ν2 7.1 μm, C2H2ν4 + ν5 7.5 μm, and CH4ν4 7.7 μm bands (García-Bernete et al. 2025b). Spectroscopic parameters for these species were obtained from the HITRAN2020 (Gordon et al. 2022) and ExoMol (Chubb et al. 2020; Yurchenko et al. 2024) databases. The strengths of the individual lines (panel b) are comparable to those of the H2O ν2 lines, which is surprising given that these bands are intrinsically weak. For the HCN 2ν2 and C2H2ν4 + ν5 bands, the Einstein coefficients for absorption of radiation (Blu) are ∼106 and ∼2.5 × 106 cm2 erg−1 s−1, respectively, while the Blu values for the backbone-backbone transitions of the H2O ν2 lines are factors of ∼5 and ∼2 higher.
We have used our model for the HC, which dominates the continuum at these wavelengths, to fit these bands, with the goals of checking the excitation predicted by the continuum model and deriving the abundances of these species. Our model uses, as for H2O, a λ-dependent covering factor fhot as defined in Eq. (4) (Section 3.2). The dilution of the molecular absorption at 7 − 8 μm is also due to the “hidden” 230 K component (Fig. 2). The best-fit model is shown in Fig. F.1b. To explain the band strengths we require extraordinary abundances relative to H2O, indicating an extreme C-rich chemistry: [HCN]/[H2O] ≈ 0.56, [C2H2]/[H2O] ≈ 0.54, and [CH4]/[H2O] ≈ 0.22. These are within a factor of 2 consistent with the values inferred by García-Bernete et al. (2025b).
The HCN ν2 14 μm and C2H2ν5 13.7 μm bands are also clearly detected (Fig. F.1c). These bands have Blu values higher than the HCN and C2H2 7.1 − 7.5 μm bands by factors of 5 − 10, and thus the P and R branch lines from the HC at 14 μm, predicted by our model for the ∼7.5 μm bands, would be expected to be strong. However, the WC continuum emission at 14 μm, here dominated by the WC 123 K component (Table 2), is expected to account for about half of the observed continuum (Figs. 2 and F.1c) and thus the 14 μm absorption from the HC is diluted with fhot ∼ 0.5 (Fig. F.1d). This dilution has the effect of reducing the predicted 14 μm high-J molecular absorption troughs at levels comparable with the observations. Using a common model for the HC, our composite continuum model thus yields consistent results for the 7.5 and 14 μm bands, which is required as the high-J lines of the R and P branches in both bands are produced by the same gas.
However, the Q branches of both 14 μm bands are saturated, and the model for the HC alone cannot reproduce them as they absorb more than 50% of the continuum. We have therefore added a model for the WC in Fig. F.1d that accounts for the remaining Q branch absorption, using a covering factor for the WC of fwarm = 1 − fhot (note that the CC contributes negligibly to the 14 μm continuum, Fig. 2). The absorbing column densities of both HCN and C2H2 in the WC are 1017 cm−2, generating absorption in the Q branches and in the low-J lines of the P and R branches. The low-J lines of the HCN 14 μm band have an additional contribution from the low-excitation shell in front of the HC, and indeed absorption is seen up to ∼ − 500 km s−1 in the uncontaminated HCN ν2 R4 line (this has the effect of lowering the apparent Td). The fit to the 14 μm bands tends to overestimate the absorption in high-excitation lines, most likely reflecting the uncertainties of fhot.
From the results for the HCN abundance found here and by García-Bernete et al. (2025b), and those for the HCO+ abundance by Speranza et al. (2025), a very high [HCN]/[HCO+] abundance ratio of ∼100 is obtained in IRAS 07251−0248 E. This result can be related to the variety of HCN/HCO+ rotational line ratios observed in galaxies, and widely discussed in the literature (e.g., Krips et al. 2008; Imanishi et al. 2009; Izumi et al. 2016). While a high HCN/HCO+ line ratio was first attributed to the chemistry involved in X-ray dominated regions around AGNs, further observations showing high ratios in non-AGN galaxies and low ratios in AGN have dismissed this relationship (e.g., Costagliola et al. 2011; Privon et al. 2020). Recently, Nishimura et al. (2024) have identified the highest HCN/HCO+ line ratios in shell-like structures kinematically associated with outflows or inflows, and their chemical models indeed indicate a strong enhancement of [HCN]/[HCO+] in shock conditions. The nuclear conditions in IRAS 07251−0248 E are more extreme than those modeled by Nishimura et al. (2024), which are appropriate for the more extended regions probed by the rotational lines, but their shock models illustrate the high [HCN]/[HCO+] ratio that can be attained in the outflow associated with the HC. Nevertheless, the additional effect of cosmic rays in enhancing the ionization rate and processing the carbonaceous grains and PAHs are most likely required to explain the extreme [HCN]/[H2] ∼ 4 × 10⁻⁵ we find in the nucleus of IRAS 07251−0248 E.
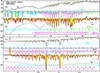 |
Fig. F.1. HCN, C2H2, and CH4 bands in IRAS 07251−0248 observed with JWST MIRI/MRS, and model fit. Abscissae are rest wavelengths in μm. Panels a and c show the observed spectra around 7.5 and 14 μm (flux densities in mJy), with the orange line indicating the adopted continuum level (i.e., the baseline) and the light-blue curve showing the contribution to the continuum by the WC. Panels b and d show the continuum normalized spectrum, with the red line showing the model result and the dashed line indicating the covering factor of the hot component (fhot). The contributions to the model by HCN, C2H2, CH4, and CO2 (and their transition labels) are indicated in light-blue, magenta, green, and brown, respectively (and vertically shifted for clarity). Note that all absorption features are blueshifted relative to the labels. |
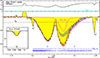 |
Fig. F.2. CO2ν3 and ν2 bands in IRAS 07251−0248 observed with JWST NIRSpec, and model fit. The upper panel a shows the observed spectrum around 4.25 μm (flux densities in mJy), with the orange line indicating the adopted continuum level (i.e., the baseline) and the light-blue curve showing the contribution to the continuum by the WC. The lower panel shows the continuum normalized spectrum, with the blue line showing the model result for the HC and the dashed line indicating the covering factor of the hot component (fhot). We have also included the required contribution to the absorption by CO2 ice (exp{−τice} in magenta); red is the resulting spectrum. The insert shows the Q branch of the CO2ν2 band at ≈15 μm, with the blue line also indicating the model result for the HC. |
Finally, we have also applied the HC model to the CO2ν3 (4.25 μm) and ν2 (14.97 μm) bands (Fig. F.2). The best fit model to both the CO2ν3 R branch and the ν2 Q branch requires [CO2]/[H2O] ≈ 0.03 at the HC photosphere, with an additional contribution by the surrounding outflowing shell with [CO2]/[H2O] ≈ 0.014. The fit, however, grossly underestimates the strength of the CO2ν3 P branch up to J ∼ 20, so we added foreground CO2 ice with H2O : CO2 = 10 : 1 (Ehrenfreund et al. 1997; Rocha et al. 2022). The resulting modeled spectrum appears to overestimate the absorption in the high-J lines of the ν3 P branch, but fits both the ν3 R branch at 4.23 μm and the ν2 Q branch at 15 μm rather well. This match validates our fit to the HC continuum.
All Tables
Best-fit parameters for the nuclear 667 μm emission of IRAS 07251−0248 E using a point-source + a Gaussian model.
Properties of the components used to model the continuum and the H2O ν2 = 1 − 0 band in IRAS 07251−0248 E.
All Figures
|
Fig. 1. ALMA 667 μm continuum emission of IRAS 07251−0248 E and model. Left: Observed emission, with colored scale in units of mJy/beam. Middle: Model, composed of an unresolved source (full-width at half maximum, FWHM < 21 mas = 34 pc) and a Gaussian source (FWHM = 89 × 86 mas2 = 146 × 141 pc2). Right: Residuals in μJy/beam. |
| In the text | |
|
Fig. 2. Spectral energy distribution (SED) of IRAS 07251−0248 E from λrest = 2.6 to 1200 μm and model. In black, the full JWST NIRSpec & MIRI/MRS spectrum is shown, together with Spitzer, Herschel/PACS (from 60 to 160 μm, both photometric and spectroscopic) and SPIRE (from 230 to 470 μm), and ALMA (667 and 1200 μm) data. The colored circles at 667 μm indicate the contributions by the unresolved (blue) and resolved (light-blue) components inferred from the model in Fig. 1. At 1.2 mm, the open black circle and the cross indicate the flux densities of the unresolved (< 82 pc) and resolved (540 × 330 pc2) components, respectively (Pereira-Santaella et al. 2021). The model includes the HC in blue (dashed: unattenuated emission; solid: attenuated), the WC in light-blue (extincted), a cold component (CC) in orange, the stellar component in gray, and the “hidden” component (whose attenuated emission is added to that of the WC, see Section 3.2) in dotted-dashed green. Red is total. The insert panels show details of the model results. Upper left: The Tdust profile of the HC. Upper right: The optical depths τ of the HC and the WC as function of wavelength. Lower middle: The Tdust profile of the HC as function of the optical depth from surface at 7 and 14 μm. |
| In the text | |
|
Fig. 3. H2O ν2 = 1 − 0 band in IRAS 07251−0248 observed with JWST MIRI/MRS. Panels a and c show the observed spectrum, with the orange line indicating the adopted continuum level and the light-blue curve showing the contribution from the warm component. Panels b and d show the continuum normalized spectrum, with the blue line showing the model result for the hot component and the dashed line indicating its covering factor (fhot). We label the main transitions that potentially contribute to the H2O band as shown in González-Alfonso et al. (2024), but some very highly-excited lines are not detected in IRAS 07251−0248. Note that all H2O absorption features are blueshifted relative to the labels. |
| In the text | |
|
Fig. 4. Schematic representation of the model source. The extremely compact and expanding core (HC) is shown in blue (the 6 μm photosphere is its external surface), with gas flowing outward (the surrounding shell outflowing at ∼ − 400 km s−1) in green. The starburst torus shown in magenta represents the WC. The torus also appears to be expanding, because the far-IR lines are blueshifted (Appendix E, Fig. E.1). Both the HC and WC are embedded in an extended cold component (CC), in orange. The model is axisymmetric about the line of sight. |
| In the text | |
|
Fig. A.1. ALMA 667 μm continuum emission of IRAS 07251−0248 E and alternative models: a point source (upper) and a Gaussian (lower). Left: Observed emission, with colored scale in units of mJy/beam. Middle: Model. Right: Residuals in μJy/beam. These models give residuals much more prominent than our best point-source + Gaussian model fit in Fig. 1. |
| In the text | |
|
Fig. D.1. Adopted absorption coefficient of dust normalized at 6 μm (black), compared to the mid-IR values obtained by Fritz et al. (2011) toward the Galactic Center (red). |
| In the text | |
|
Fig. D.2. Line profiles of some emission lines as compared with two low-excitation H2O ν2 = 1 − 0 absorption lines. The velocity scale on the abscissa is calculated with a redshift of z = 0.08778. All mid-IR molecular absorption lines have peak absorption blueshifted by 100 − 200 km s−1 relative to the peak emission lines, as exemplified by the H2O lines. Note that the rotational CO 2-1 line shows absorption below the continuum at velocities from −350 to −570 km s−1 as highlighted in the insert, consistent with the H2O wing absorption at similar velocities. |
| In the text | |
|
Fig. E.1. H2O ν2 = 1 − 0 line profiles in IRAS 07251−0248 observed with JWST MIRI/MRS. Filled histograms are the observed profiles and blue lines are model results. Abscissa represents velocity (in km s−1) and ordinate is continuum-normalized. All detected lines have a peak absorption that is blueshifted by 100 − 200 km s−1. The selected transitions are R or Q branch lines that are not extremely blended and cover a representative range of level energies. Note that some displayed lines are not detected (right column). The energy level diagram corresponds to the ground state, with levels involved in the displayed profiles shown in red. |
| In the text | |
|
Fig. E.2. Herschel/PACS continuum-subtracted spectra of IRAS 07251−0248 around 119, 79, and 65 μm (filled histograms), and model fit. The upper scale in each panel is velocity in km s−1 relative to the blue component of each OH doublet, and the two vertical dotted lines indicate the positions of the two OH l−doubling components (rest wavelengths are calculated for a redshift z = 0.08778). The contribution to the modeled spectrum by different species and components is shown with different colors as labeled in panel (a); red is total. |
| In the text | |
|
Fig. F.1. HCN, C2H2, and CH4 bands in IRAS 07251−0248 observed with JWST MIRI/MRS, and model fit. Abscissae are rest wavelengths in μm. Panels a and c show the observed spectra around 7.5 and 14 μm (flux densities in mJy), with the orange line indicating the adopted continuum level (i.e., the baseline) and the light-blue curve showing the contribution to the continuum by the WC. Panels b and d show the continuum normalized spectrum, with the red line showing the model result and the dashed line indicating the covering factor of the hot component (fhot). The contributions to the model by HCN, C2H2, CH4, and CO2 (and their transition labels) are indicated in light-blue, magenta, green, and brown, respectively (and vertically shifted for clarity). Note that all absorption features are blueshifted relative to the labels. |
| In the text | |
|
Fig. F.2. CO2ν3 and ν2 bands in IRAS 07251−0248 observed with JWST NIRSpec, and model fit. The upper panel a shows the observed spectrum around 4.25 μm (flux densities in mJy), with the orange line indicating the adopted continuum level (i.e., the baseline) and the light-blue curve showing the contribution to the continuum by the WC. The lower panel shows the continuum normalized spectrum, with the blue line showing the model result for the HC and the dashed line indicating the covering factor of the hot component (fhot). We have also included the required contribution to the absorption by CO2 ice (exp{−τice} in magenta); red is the resulting spectrum. The insert shows the Q branch of the CO2ν2 band at ≈15 μm, with the blue line also indicating the model result for the HC. |
| In the text | |
Current usage metrics show cumulative count of Article Views (full-text article views including HTML views, PDF and ePub downloads, according to the available data) and Abstracts Views on Vision4Press platform.
Data correspond to usage on the plateform after 2015. The current usage metrics is available 48-96 hours after online publication and is updated daily on week days.
Initial download of the metrics may take a while.