Fig. F.2.
Download original image
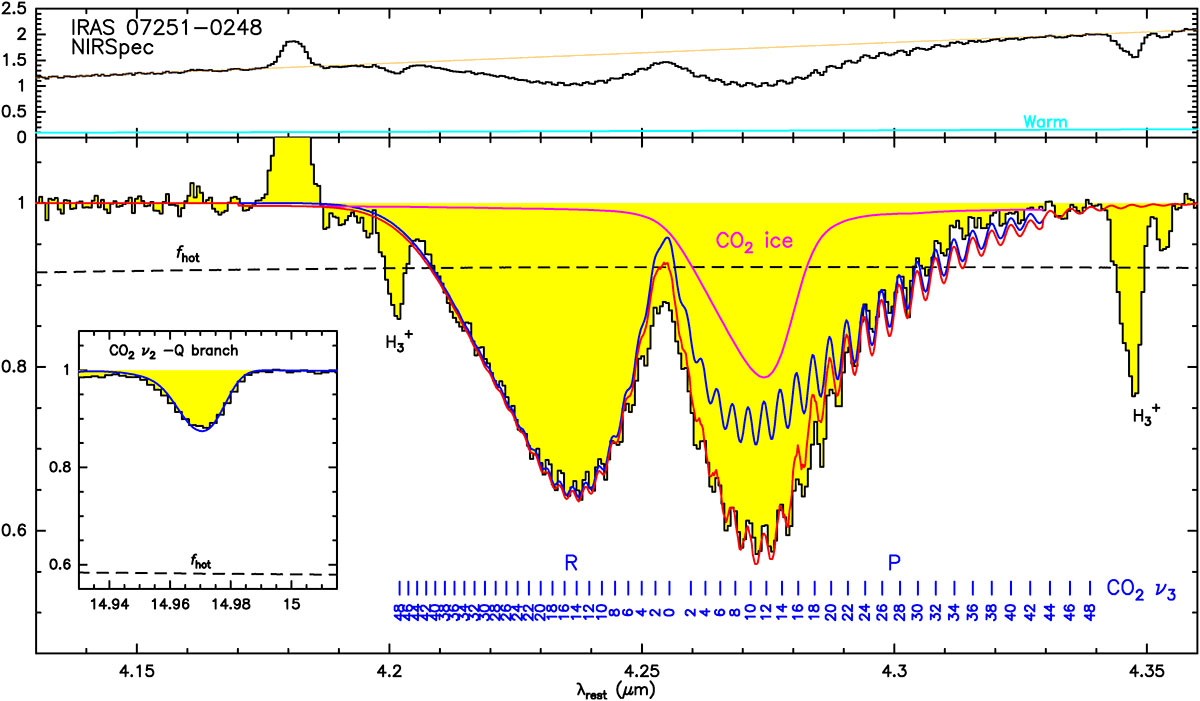
CO2ν3 and ν2 bands in IRAS 07251−0248 observed with JWST NIRSpec, and model fit. The upper panel a shows the observed spectrum around 4.25 μm (flux densities in mJy), with the orange line indicating the adopted continuum level (i.e., the baseline) and the light-blue curve showing the contribution to the continuum by the WC. The lower panel shows the continuum normalized spectrum, with the blue line showing the model result for the HC and the dashed line indicating the covering factor of the hot component (fhot). We have also included the required contribution to the absorption by CO2 ice (exp{−τice} in magenta); red is the resulting spectrum. The insert shows the Q branch of the CO2ν2 band at ≈15 μm, with the blue line also indicating the model result for the HC.
Current usage metrics show cumulative count of Article Views (full-text article views including HTML views, PDF and ePub downloads, according to the available data) and Abstracts Views on Vision4Press platform.
Data correspond to usage on the plateform after 2015. The current usage metrics is available 48-96 hours after online publication and is updated daily on week days.
Initial download of the metrics may take a while.