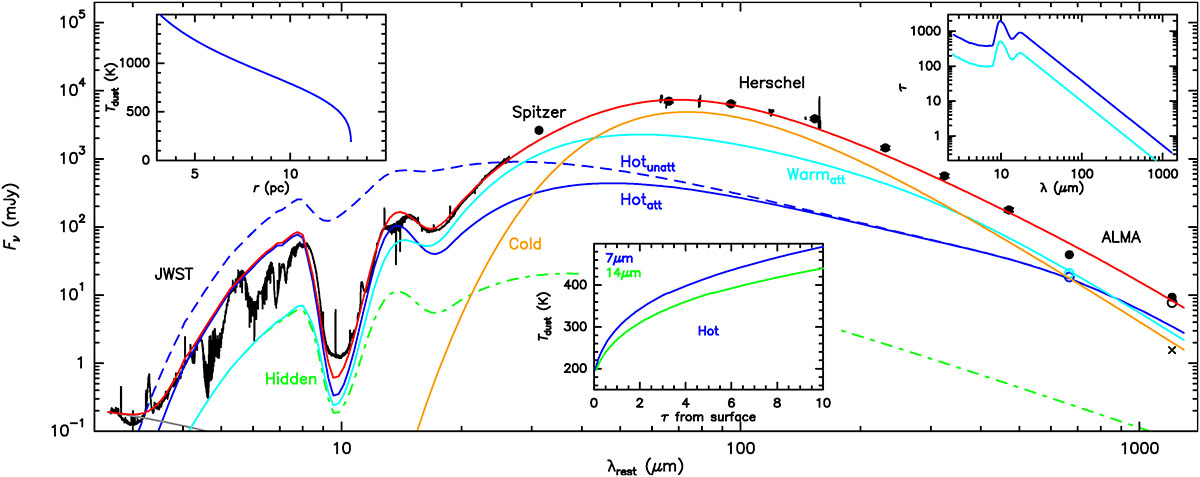
Fig. 2.
Download original image
Spectral energy distribution (SED) of IRAS 07251−0248 E from λrest = 2.6 to 1200 μm and model. In black, the full JWST NIRSpec & MIRI/MRS spectrum is shown, together with Spitzer, Herschel/PACS (from 60 to 160 μm, both photometric and spectroscopic) and SPIRE (from 230 to 470 μm), and ALMA (667 and 1200 μm) data. The colored circles at 667 μm indicate the contributions by the unresolved (blue) and resolved (light-blue) components inferred from the model in Fig. 1. At 1.2 mm, the open black circle and the cross indicate the flux densities of the unresolved (< 82 pc) and resolved (540 × 330 pc2) components, respectively (Pereira-Santaella et al. 2021). The model includes the HC in blue (dashed: unattenuated emission; solid: attenuated), the WC in light-blue (extincted), a cold component (CC) in orange, the stellar component in gray, and the “hidden” component (whose attenuated emission is added to that of the WC, see Section 3.2) in dotted-dashed green. Red is total. The insert panels show details of the model results. Upper left: The Tdust profile of the HC. Upper right: The optical depths τ of the HC and the WC as function of wavelength. Lower middle: The Tdust profile of the HC as function of the optical depth from surface at 7 and 14 μm.
Current usage metrics show cumulative count of Article Views (full-text article views including HTML views, PDF and ePub downloads, according to the available data) and Abstracts Views on Vision4Press platform.
Data correspond to usage on the plateform after 2015. The current usage metrics is available 48-96 hours after online publication and is updated daily on week days.
Initial download of the metrics may take a while.