Fig. 3.
Download original image
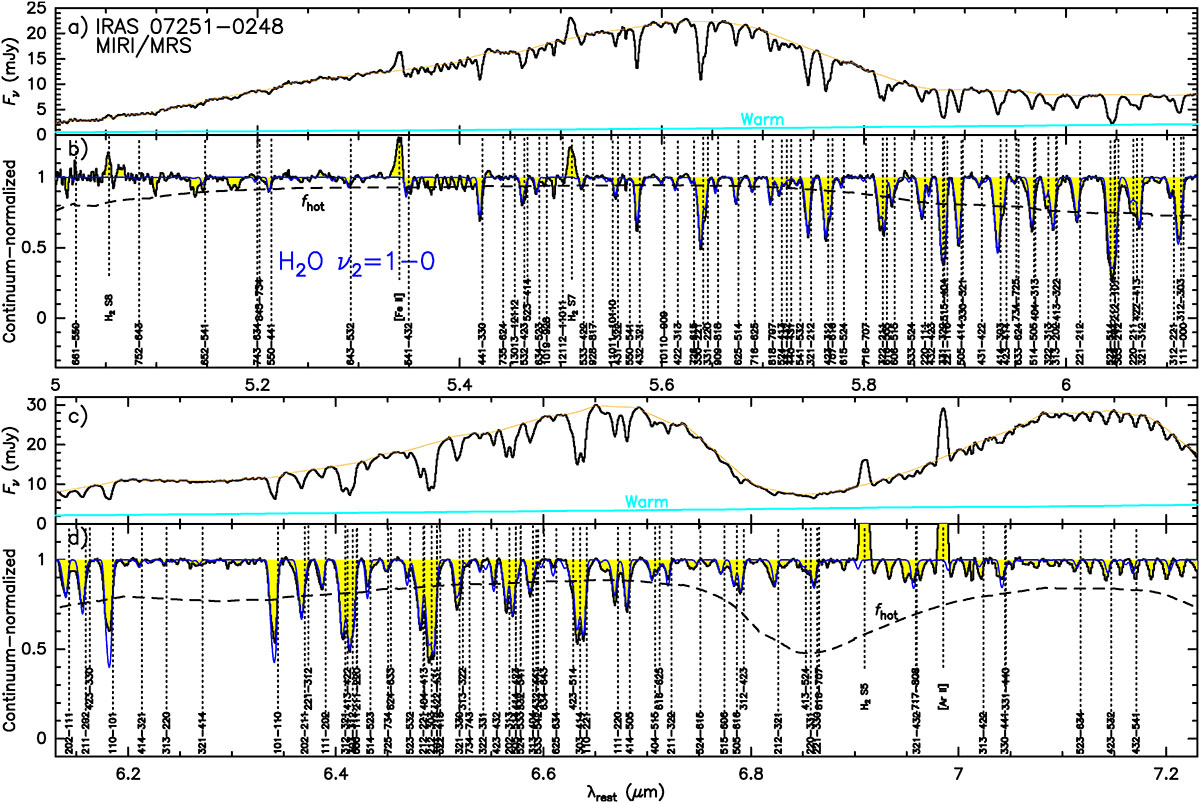
H2O ν2 = 1 − 0 band in IRAS 07251−0248 observed with JWST MIRI/MRS. Panels a and c show the observed spectrum, with the orange line indicating the adopted continuum level and the light-blue curve showing the contribution from the warm component. Panels b and d show the continuum normalized spectrum, with the blue line showing the model result for the hot component and the dashed line indicating its covering factor (fhot). We label the main transitions that potentially contribute to the H2O band as shown in González-Alfonso et al. (2024), but some very highly-excited lines are not detected in IRAS 07251−0248. Note that all H2O absorption features are blueshifted relative to the labels.
Current usage metrics show cumulative count of Article Views (full-text article views including HTML views, PDF and ePub downloads, according to the available data) and Abstracts Views on Vision4Press platform.
Data correspond to usage on the plateform after 2015. The current usage metrics is available 48-96 hours after online publication and is updated daily on week days.
Initial download of the metrics may take a while.