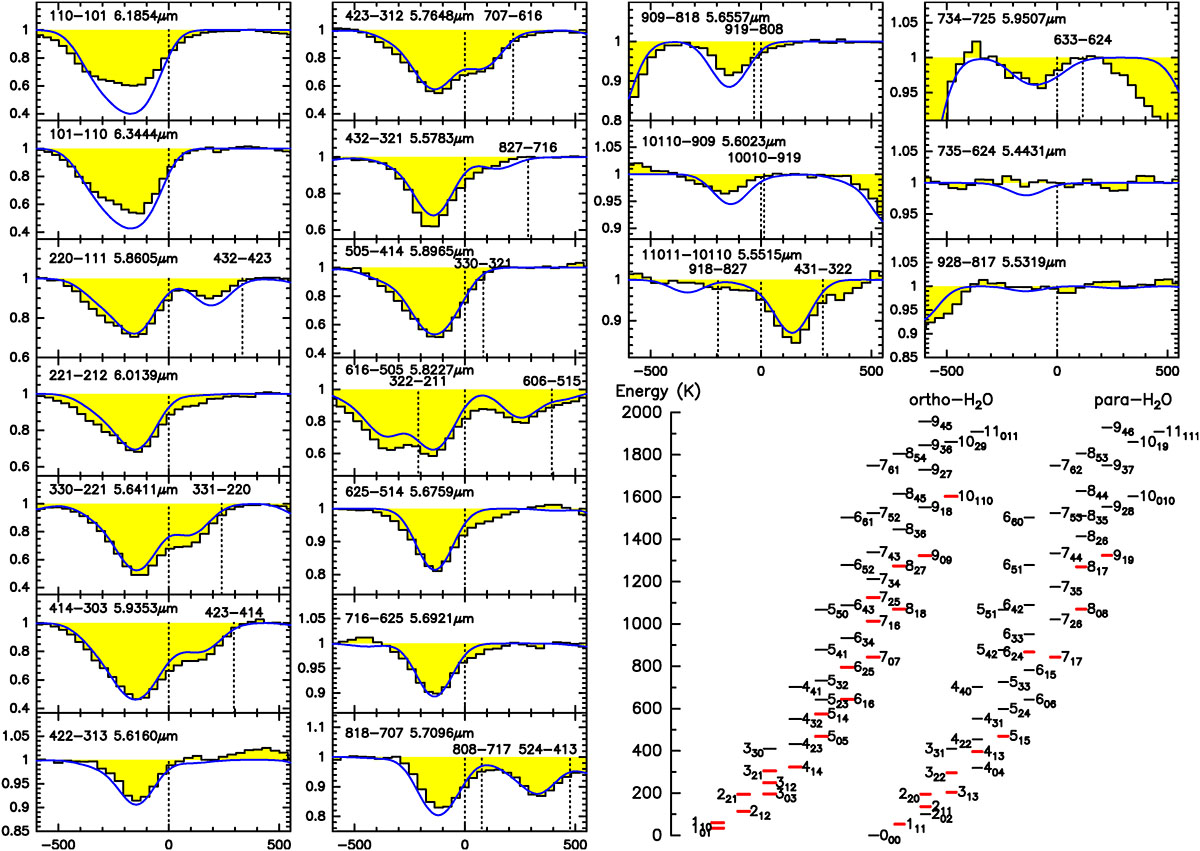
Fig. E.1.
Download original image
H2O ν2 = 1 − 0 line profiles in IRAS 07251−0248 observed with JWST MIRI/MRS. Filled histograms are the observed profiles and blue lines are model results. Abscissa represents velocity (in km s−1) and ordinate is continuum-normalized. All detected lines have a peak absorption that is blueshifted by 100 − 200 km s−1. The selected transitions are R or Q branch lines that are not extremely blended and cover a representative range of level energies. Note that some displayed lines are not detected (right column). The energy level diagram corresponds to the ground state, with levels involved in the displayed profiles shown in red.
Current usage metrics show cumulative count of Article Views (full-text article views including HTML views, PDF and ePub downloads, according to the available data) and Abstracts Views on Vision4Press platform.
Data correspond to usage on the plateform after 2015. The current usage metrics is available 48-96 hours after online publication and is updated daily on week days.
Initial download of the metrics may take a while.