Fig. E.2.
Download original image
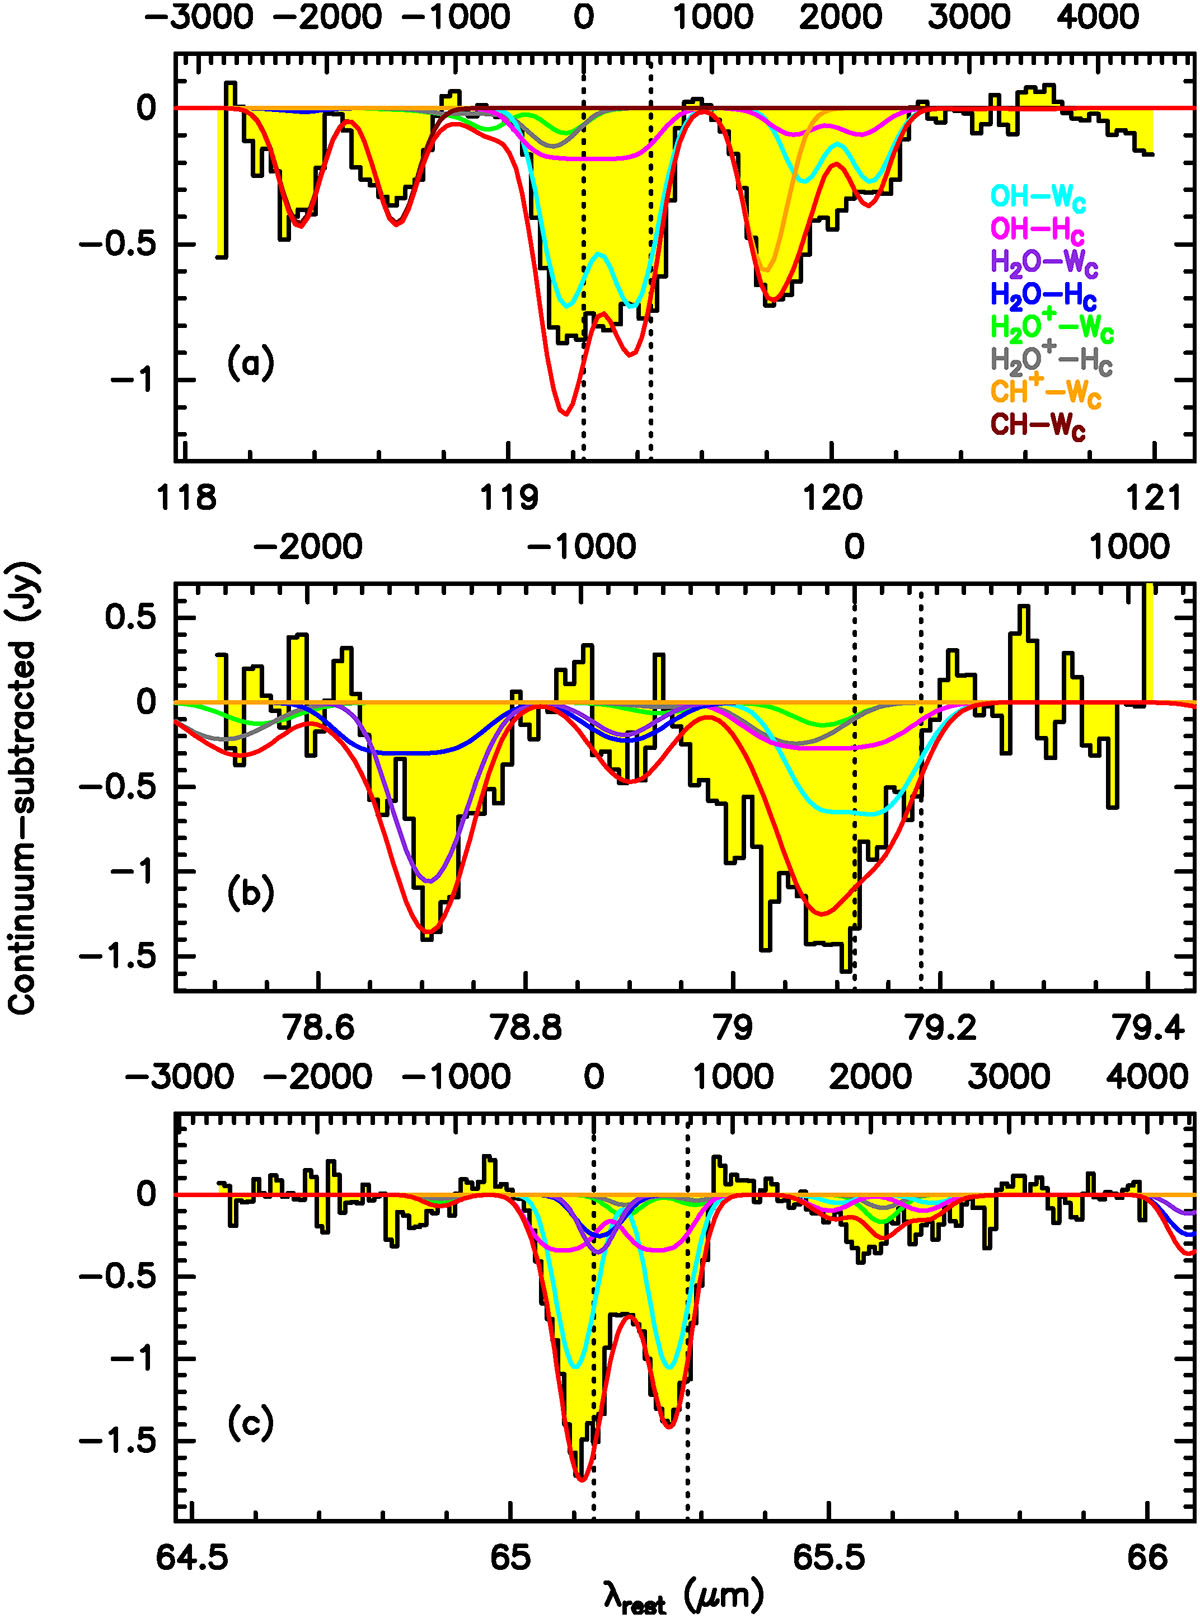
Herschel/PACS continuum-subtracted spectra of IRAS 07251−0248 around 119, 79, and 65 μm (filled histograms), and model fit. The upper scale in each panel is velocity in km s−1 relative to the blue component of each OH doublet, and the two vertical dotted lines indicate the positions of the two OH l−doubling components (rest wavelengths are calculated for a redshift z = 0.08778). The contribution to the modeled spectrum by different species and components is shown with different colors as labeled in panel (a); red is total.
Current usage metrics show cumulative count of Article Views (full-text article views including HTML views, PDF and ePub downloads, according to the available data) and Abstracts Views on Vision4Press platform.
Data correspond to usage on the plateform after 2015. The current usage metrics is available 48-96 hours after online publication and is updated daily on week days.
Initial download of the metrics may take a while.