Fig. 1.
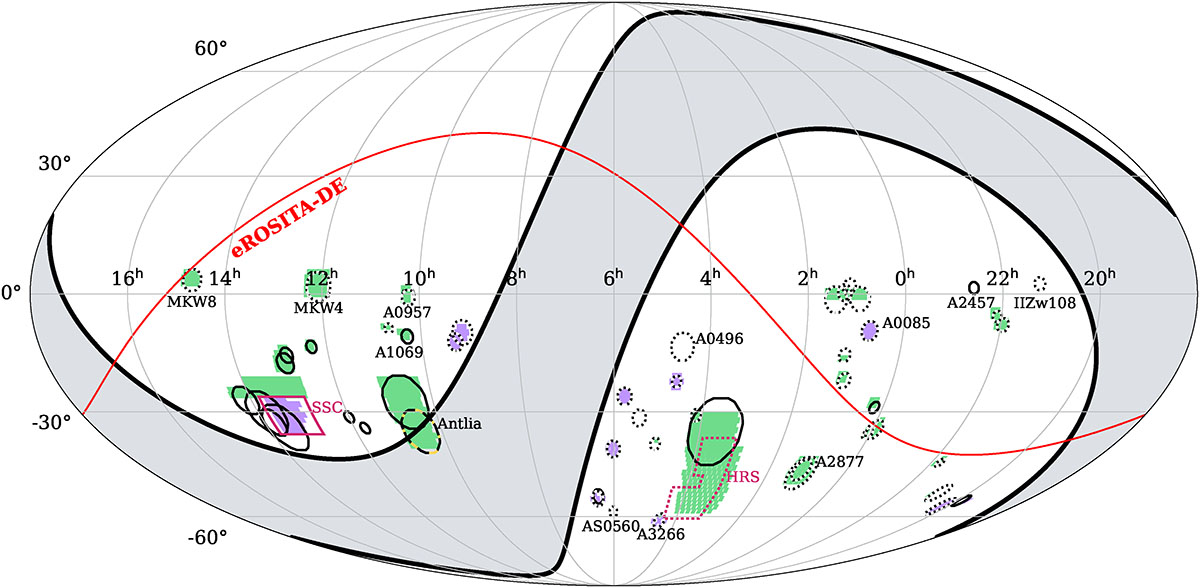
Download original image
Photometric data coverage for the CHANCES Low-z sub-survey. Black circles show the CHANCES-Low-z cluster location with their corresponding 5 × R200 regions. The Horologium-Reticulum (HRS) and Shapley (SSC) superclusters regions are shown in magenta dashed boxes. The S-PLUS -DR4 and -iDR5 footprint coverage around our clusters are shown in green, while the additional CHANCES-T80S campaigns are shown in purple. The clusters with available LS-DR9 photometric redshifts are showed with dotted circles, while 51 of 50+2 clusters (except from Antlia, yellow dash-dotted circle) from our sample are covered by LS-DR10 and LS-DR10-CBPF photometric redshifts. The grey shaded region bounded by black solid lines shows Galactic latitudes |b|≤20°, while the region below the red curve corresponds to the eROSITA-DE survey (Merloni et al. 2024).
Current usage metrics show cumulative count of Article Views (full-text article views including HTML views, PDF and ePub downloads, according to the available data) and Abstracts Views on Vision4Press platform.
Data correspond to usage on the plateform after 2015. The current usage metrics is available 48-96 hours after online publication and is updated daily on week days.
Initial download of the metrics may take a while.