| Issue |
A&A
Volume 706, February 2026
|
|
|---|---|---|
| Article Number | A34 | |
| Number of page(s) | 21 | |
| Section | Extragalactic astronomy | |
| DOI | https://doi.org/10.1051/0004-6361/202556796 | |
| Published online | 27 January 2026 | |
Targeting cluster galaxies for the 4MOST CHANCES Low-z sub-survey with photometric redshifts
1
Departamento de Astronomía, Universidad de La Serena Avda. Raúl Bitrán 1305 La Serena, Chile
2
Departamento de Física, Universidad Técnica Federico Santa María Avenida España 1680 Valparaíso, Chile
3
Instituto de Astronomía y Ciencias Planetarias (INCT), Universidad de Atacama Copayapu 485 Copiapó, Chile
4
Millennium Nucleus for Galaxies (MINGAL) Valparaíso, Chile
5
Centro Brasileiro de Pesquisas Físicas Rua Dr. Xavier Sigaud 150 22290-180 Rio de Janeiro RJ, Brazil
6
Departamento de Astronomia, Instituto de Astronomia, Geofísica e Ciências Atmosféricas, Universidade de São Paulo, Rua do Matão 1226, Cidade Universitária São Paulo 05508-090, Brazil
7
Institute of Astronomy, University of Cambridge Madingley Road Cambridge CB3 0HA, United Kingdom
8
Institute of Astrophysics, Facultad de Ciencias Exactas, Universidad Andrés Bello Sede Concepción Talcahuano, Chile
9
Department of Physics, University of Helsinki Gustaf Hällströminkatu 2 00560 Helsinki, Finland
10
Instituto de Astrofísica de La Plata, CONICET-UNLP Paseo del Bosque s/n B1900FWA La Plata, Argentina
11
Facultad de Ciencias Astronómicas y Geofísicas, Universidad Nacional de La Plata Paseo del Bosque s/n B1900FWA La Plata, Argentina
12
INAF – Osservatorio Astronomico di Capodimonte Salita Moiariello 16 80131 Napoli, Italy
13
Instituto de Física, Pontificia Universidad Católica de Valparaíso Casilla 4059 Valparaíso, Chile
14
Departamento de Física Teórica y del Cosmos, Edificio Mecenas, Campus Fuentenueva, Universidad de Granada E-18071 Granada, Spain
15
Instituto Universitario Carlos I de Física Teórica y Computacional, Universidad de Granada 18071 Granada, Spain
16
Instituto de Física y Astronomía, Universidad de Valparaíso Avda. Gran Bretaña 1111 Valparaíso, Chile
17
School of Physics & Astronomy, University of Nottingham Nottingham NG7 2RD, UK
18
Valongo Observatory, Federal University of Rio de Janeiro, Ladeira do Pedro Antônio 43 Saúde CEP 20080-090 Rio de Janeiro RJ, Brazil
19
Departamento de Astronomía, Universidad de Chile Casilla 36-D Santiago, Chile
20
School of Physics and Astronomy, University of Birmingham Birmingham B15 2TT, UK
21
Departamento de Física y Astronomía, Instituto de Astrofísica, Universidad Andres Bello Fernandez Concha 700 Las Condes Santiago 7591538, Chile
22
INAF-Osservatorio Astronomico di Padova Vicolo dell’Osservatorio 5 35136 Padova, Italy
23
European Southern Observatory, Science Operations Alonso de Cordova 3107 Vitacura 19001 Santiago, Chile
24
Cerro Tololo Inter-American Observatory, NSF’s National Optical-Infrared Astronomy Research Laboratory Casilla 603 La Serena, Chile
25
Instituto Nacional de Pesquisas Espaciais (INPE/MCTI), Av. dos Astronautas 1758 São José dos Campos SP, Brazil
26
Center for Theoretical Physics, Polish Academy of Sciences al. Lotników 32/46 02-668 Warsaw, Poland
27
Chinese Academy of Sciences South America Center for Astronomy, National Astronomical Observatories, CAS Beijing 100101, China
28
Key Laboratory of Optical Astronomy, NAOC street20A Datun Road Chaoyang District Beijing 100101, China
29
Laboratório Nacional de Astrofísica (LNA), Rua dos Estados Unidos 154, Bairro das Nações 37504-364 Itajubá MG, Brazil
30
Universidade Federal de Santa Catarina, Campus Universitário Reitor João David Ferreira Lima Florianópolis 88040-900, Brazil
31
Observatório Nacional / MCTIC Rua General José Cristino 77 Rio de Janeiro RJ 20921-400, Brazil
32
Departamento de Física Matemática, Instituto de Física, Universidade de São Paulo, SP Rua do Matão 1371 São Paulo, Brazil
33
Escola Politecnica, Universidade de São Paulo, Av. Prof. Luciano Gualberto, travessa do politecnico 380 São Paulo 05508-010, Brazil
34
Rubin Observatory Project Office 950 N. Cherry Ave Tucson 85719, USA
35
Institute of Astronomy, Faculty of Physics, Astronomy and Informatics, Nicolaus Copernicus University Grudziadzka 5 PL-87-100 Toruń, Poland
36
Univ. Lyon1, Ens de Lyon, CNRS, Centre de Recherche Astrophysique de Lyon (CRAL) UMR5574 F-69230 Saint-Genis-Laval, France
37
Universidade do Vale do Paraíba, Av. Shishima Hifumi 2911 São José dos Campos 12244-000 SP, Brazil
38
Universidade Estadual de Feira de Santana, Departamento de Física Feira de Santana BA 44.036-900, Brazil
39
The Observatories of the Carnegie Institution for Science 813 Santa Barbara St Pasadena CA 91101, USA
★ Corresponding author: This email address is being protected from spambots. You need JavaScript enabled to view it.
Received:
8
August
2025
Accepted:
12
October
2025
Abstract
Context. The evolution of galaxies is shaped by both internal processes and their external environments. Galaxy clusters and their surroundings provide ideal laboratories to study these effects, particularly with respect to mechanisms such as quenching and morphological transformation. The Chilean Cluster galaxy Evolution Survey (CHANCES) Low-z sub-survey is part of the CHileAN Cluster galaxy Evolution Survey, a 4MOST community survey designed to uncover the relationship between the formation and evolution of galaxies and hierarchical structure formation as it happens, through deep and wide multi-object spectroscopy.
Aims. We present the target selection strategy followed to select galaxy cluster candidate members for the CHANCES Low-z sub-survey. The selection was focussed in and around 50 clusters and two superclusters at z < 0.07, out to (5 × R200) and down to mr = 20.4.
Methods. Combining public photometric redshift estimates from the DESI Legacy Imaging Survey and T80S/S-PLUS iDR5 with custom photometric redshifts, we were able to identify likely galaxy cluster candidate members, whose photometric redshifts were consistent with being located at the known redshift of the cluster. We measured the average deviations of their photometric redshifts with respect to the spectroscopic redshift measurements, σNMAD. We tested various selection parameters to maximise completeness, while maintaining purity.
Results. We successfully compiled our CHANCES-low-redshift catalogues, split into three different sub-surveys: Low-z bright (mr < 18.5), Low-z faint (18.5 ≤ mr < 20.4), and Low-z faint supplementary. To do so, we selected ≳500 000 galaxy cluster candidate members and included confirmed spectroscopic galaxy cluster members, from which we expect to obtain 4MOST low-resolution (R ∼ 6500) spectra for ∼320 000 galaxies.
Conclusions. The CHANCES Low-z target catalogues form a statistically robust sample for spectroscopic follow-up, enabling studies of galaxy evolution and environmental effects in nearby cluster and supercluster environments.
Key words: techniques: miscellaneous / surveys / galaxies: clusters: general
© The Authors 2026
 Open Access article, published by EDP Sciences, under the terms of the Creative Commons Attribution License (https://creativecommons.org/licenses/by/4.0), which permits unrestricted use, distribution, and reproduction in any medium, provided the original work is properly cited.
This article is published in open access under the Subscribe to Open model. This email address is being protected from spambots. You need JavaScript enabled to view it. to support open access publication.
1. Introduction
Numerous studies have established that the evolution of galaxies is governed by a complex interplay of internal processes and external environmental influences. While massive galaxies are almost all quenched, regardless of environment, the quenching of star formation in dwarf galaxies with masses below 109 M⊙ is largely driven by environment (Peng et al. 2010; Geha et al. 2012). Quiescent dwarf galaxies are almost always being found in groups, clusters or as satellites of more massive galaxies (Haines et al. 2007). In particular, galaxy clusters are known to be very effective at removing interstellar gas (Gunn & Gott 1972; Larson et al. 1980; Kennicutt 1983; Byrd & Valtonen 1990), altering the star formation of galaxies (Dressler 1984; Lewis et al. 2002) and even transforming them morphologically (Dressler 1980; Postman & Geller 1984; Dressler et al. 1997). However, not all galaxies transform and quench inside of clusters, in fact, many arrive into clusters already quenched. The quenching of galaxies in lower-density environments such as groups and filaments prior entering the cluster is referred to as pre-processing (Zabludoff & Mulchaey 1998; Fujita 2004; Haines et al. 2015; Bianconi et al. 2018; Pallero et al. 2019; Kuchner et al. 2022; Lopes et al. 2024).
Observational evidence already supports the significance of pre-processing in various cosmic structures. For example, studies of the Fornax A group reveal galaxies at different stages of pre-processing, with variations in their HI content and molecular hydrogen conversion rates (Loubser et al. 2024). Similarly, the Coma Supercluster demonstrates a progression of environmental quenching, where galaxies in filaments and groups exhibit systematically lower star formation rates as they approach the cluster core (Jiménez-Teja et al. 2025). However, current studies are often limited in depth and sky coverage, emphasising the need for broader and deeper surveys.
Despite significant progress in quantifying the importance of pre-processing in galaxy evolution, several open questions remain. For instance, we ought to consider the dominant mechanisms responsible for quenching star formation before cluster infall and how morphological transformation proceeds in different environments. Addressing these questions requires statistically significant datasets that capture galaxies across a wide range of environments and mass regimes.
To fully characterise pre-processing and its impact on galaxy evolution, deep and wide-area surveys are essential. Large-scale surveys covering extensive portions of the cosmic web can provide the necessary statistical power to disentangle environmental influences from intrinsic galaxy properties. Furthermore, reaching lower stellar mass limits is critical in identifying trends that might be masked when focusing only on massive galaxies. This is precisely the objective of the CHileAN Cluster galaxy Evolution Survey (CHANCES; Haines et al. 2023; Sifón et al. 2025). The CHANCES-Low-z survey is poised to obtain ∼320 000 galaxy spectra in and around more than 100 clusters and two superclusters(Horologium-Reticulum (HRS) and Shapley (SSC) superclusters) at 0 < z < 0.45 with the 4MOST instrument (de Jong et al. 2019). This wealth of data will enable us to study galaxy pre-processing prior to cluster infall out to 5 × R200 and down to mr = 20.4 mag, with log10(M★/M⊙)∼8.2.
The CHANCES Low-z sub-survey is part of the CHileAN Cluster galaxy Evolution Survey1, a 4MOST community survey designed to uncover the relationship between the formation and evolution of galaxies and hierarchical structure formation as it happens, through deep and wide multi-object spectroscopy. CHANCES is split into three sub-surveys: CHANCES Low-z, Evolution, and Circumgalactic Medium (CGM) (see Haines et al. 2023, for details). The CHANCES-Low-z sub-survey targets galaxies brighter than mr = 20.4 in 50 clusters out to 5 × R200 and 2 large supercluster regions at z < 0.07. The Evolution sub-survey will observe 50 clusters at 0.07 < z < 0.45 with the same magnitude limit and coverage out to 5 × R200 (Haines et al., in prep.) while CHANCES CGM focuses on QSOs lying behind massive galaxy clusters at z > 0.35, to detect any Mg II absorption associated with galaxy clusters and their surroundings (Méndez-Hernández et al., in prep.). The cluster selection, properties, and supercluster regions are detailed in (Sifón et al. 2025).
One of the main tasks for the preparation of the survey has been a careful target selection, which involves selecting the most likely galaxy cluster candidate members based on photometric information without biasing the galaxy sample or compromising completeness. This paper offers a detailed description of the target selection performed for CHANCES Low-z, the most challenging of the three sub-surveys, for all but one cluster in this sub-survey. We note that the strategy we followed to select galaxy cluster candidate members did not include Antlia. The Antlia cluster presents some differences to what is detailed here, since there are no Legacy Survey data available for Antlia which we use for all clusters to select their targets, and it is too close(z ≤ 0.012) for obtaining reliable photometric redshift(hereafter photo-z or zphot) determinations. The selection for the Antlia cluster will be presented in Lima-Dias et al. (in prep.). This paper is organised as follows. Section 2 presents the data used for the target selection, Section 3 explains the strategy followed for selecting the galaxy cluster candidate members, Section 4 presents the environmental analysis of one of our cluster sample using the final CHANCES-Low-z catalogues. Finally our conclusions are presented in Section 5.
We assume a flat λ cold dark matter (λCDM) cosmology with cosmological parameters corresponding to the central values inferred from the Planck cosmic microwave background (CMB) observations (Planck Collaboration VI 2020). Of these, the most relevant ones are: the current expansion rate, H0 = 67.4 km s−1 Mpc−1, and the present-day matter density parameter, Ωm = 0.315.
2. Data
CHANCES Low-z will target 50 clusters and two supercluster regions at z < 0.07. The selection criteria for the clusters are explained in detail in Sifón et al. (2025). In short, we used literature catalogues based on X-ray emission and the Sunyaev-Zel’dovich effect to define the cluster sample in a homogeneous way, considering cluster mass and redshift, as well as the availability of ancillary data such as the DESI Legacy Imaging Survey (LS, Dey et al. 2019, hereafter LS) and S-PLUS (Mendes de Oliveira et al. 2019) photometry to facilitate the selection of target galaxies. As a result, we sampled known clusters with an essentially uniform distribution in mass at M200 ≳ 1014 M⊙, plus a few well-known lower-mass systems. The distribution of the clusters in the sky and the data coverage is shown in Figure 1.
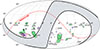 |
Fig. 1. Photometric data coverage for the CHANCES Low-z sub-survey. Black circles show the CHANCES-Low-z cluster location with their corresponding 5 × R200 regions. The Horologium-Reticulum (HRS) and Shapley (SSC) superclusters regions are shown in magenta dashed boxes. The S-PLUS -DR4 and -iDR5 footprint coverage around our clusters are shown in green, while the additional CHANCES-T80S campaigns are shown in purple. The clusters with available LS-DR9 photometric redshifts are showed with dotted circles, while 51 of 50+2 clusters (except from Antlia, yellow dash-dotted circle) from our sample are covered by LS-DR10 and LS-DR10-CBPF photometric redshifts. The grey shaded region bounded by black solid lines shows Galactic latitudes |b|≤20°, while the region below the red curve corresponds to the eROSITA-DE survey (Merloni et al. 2024). |
Wide-field photometric observations in multiple narrow- and broad-band filters allow us to derive accurate photometric redshifts of galaxies which we can use to compute the cluster membership and characterise the environment. At the same time, the photometry allows for the study of galaxy transformations through their morphologies and spatially-resolved stellar populations.
To construct the CHANCES Low-z cluster galaxy target catalogues, we made use of LS and S-PLUS photometric datasets from which different photometric redshifts are available, (e.g., from DR9 & DR10 Legacy Survey and from S- PLUS-DR4) to select galaxy cluster candidate members.
2.1. DESI Legacy Imaging Survey
The DESI Legacy Imaging Surveys are a combination of three public projects: Dark Energy Camera Legacy Survey (DECaLS), Beijing–Arizona Sky Survey (BASS), and Mayall z-band Legacy Survey (MzLS). Overall, LS provides deep optical and infrared imaging across over 14 000 deg2, covering both the North and South Galactic Caps, utilising the g, r, z bands from DECaLS, BASS, and MzLS, along with W1 and W2 bands from WISE (Dey et al. 2019). The DECaLS imaging was acquired with Dark Energy Camera (DECam, DePoy et al. 2008) on the Blanco 4-meter telescope at CTIO, Chile, reaching 5σ depths in extinction-corrected magnitudes of 24.39, 23.82, and 22.95, in the g, r, and z bands, respectively (Dey et al. 2019). The images have been processed through the NOAO community pipeline, Legacy-pipeline, optimised for precise source extraction and photometry. The photometric processing employs the Tractor algorithm, which models source fluxes using parametric profiles convolved with the point spread function (PSF), ensuring consistent photometry across varying observational conditions, and produces probabilistic inference on source properties.
Photometric redshifts for LS were derived using machine learning techniques. Zhou et al. (2021, 2023) implemented a random forest algorithm trained on spectroscopic redshifts(hereafter spec-z or zspec) from approximately 2.2 million galaxies, achieving a normalised redshift bias of 2.4 × 10⁻⁴ and a scatter σNMAD of 0.02, with an outlier rate near 5.1%. Photometric redshifts have been calculated for all galaxies with at least one exposure in each of the grz-bands (i.e. NOBS_G, NOBS_R, NOBS_Z ≥1) and have been incorporated into the LS DR9 and DR10 data releases. These photometric redshifts are expected to be reliable for galaxies with z-band magnitudes brighter than 21 (Zhou et al. 2021, 2023). The resulting LS catalogues offer comprehensive photometric and redshift information, facilitating studies of galaxy evolution and large-scale structure. We note that 49 of 50 clusters (excluding Antlia) and the HRS and SSC superclusters are covered by LS-DR10.
CHANCES Low-z targets were taken from LS-DR10. This latest data release includes additional DECam data from Dark Energy Survey (Dark Energy Survey Collaboration 2016; de Jong et al. 2015; Shanks et al. 2015), the DELVE Survey (Drlica-Wagner et al. 2021), and the DECam eROSITA Survey (DeROSITAS; Zenteno et al. 2025), including the i-band imaging from those surveys. We make use of the LS-DR10 bricks covering a 15′×15′ sky patch to create our LS-DR10 parent catalogues from which we selected the galaxy cluster candidate members by adopting the following criteria. We select unique objects and ensure they match with GAIA DeAngeli23,GAIADR3 by using the following conditions in combination: (cat[’type’] != ’DUP’) & (cat[’brick_primary’] == True). The first condition ensures excluding Gaia sources that are coincident with sources modelled with extended fit by the Tractor fitter. Such sources were retained and do not have optical flux assigned in the individual tractor tables. The second condition allowed us to select the best observation of a source when it appears in multiple bricks. We remove star-like point sources by imposing (cat [’type’] != ’PSF’). Finally, we convert LS-DR10 flux measurements in units of nanomaggies into magnitudes by making use of the equation mX = 22.5 − 2.5 × log10(fX), where fX represents the flux of a given passband in nanomaggies. Errors on magnitudes have been then retrieved from the flux_ivar column with the equation  .
.
We used LS-DR10 as our parent photometric catalogues throughout CHANCES, ensuring uniform photometric and astrometric calibrations. Since CHANCES targets have to share the focal plane with other 4MOST surveys, it is mandatory that all surveys share the same astrometric solution. LS-DR10 is widely used as the parent photometric catalogues of the 4MOST extragalactic surveys, and has its astrometry tied to GAIA DR2. Figure 1 shows the CHANCES-Low-z sample distribution. Each circle corresponds to the 5 × R200 radius, dotted circles indicate those clusters also covered by LS-DR9 zphot. Out of the 50+2 Low-z clusters, 34 are covered by LS-DR9 zphot while all clusters, except for Antlia, of the CHANCES-Low-z sample are covered by LS-DR10 zphot.
Nevertheless, we noted that the faint (18.5 < mr < 20.5) low-mass cluster galaxies at z < 0.07 are largely absent from the training sets used by Zhou et al. (2021, 2023). This is mainly caused by redshift and colour cuts applied to some of the main deep surveys (e.g. SDSS-DR14 Abolfathi et al. 2018; Strauss et al. 2002 BOSS Dawson et al. 2012, 2016, VIPERS Scodeggio et al. 2018, DEEP2 Newman et al. 2013, DESI DESI Collaboration 2016a,b, 2024, SDSS-DR16 Ahumada et al. 2020) used in the LS-DR9 and LS-DR10 photo-z training samples, that exclude Low-z galaxies(i.e. BOSS target galaxies at 0.15 < z < 0.70 while VIPERS and DEEP2 exclude galaxies at z ≲ 0.5). For this reason we urge the need to develop our own photo-z based on LS-DR10 photometric datasets, as is explained in the following section.
2.2. CHANCES Legacy Survey zphot estimations
The publicly available photometric redshifts from LS-DR10 provide a valuable initial resource for our target selection. However, we identified a need to re-estimate these zphot to better suit our scientific objectives, especially at the faint-end. To this end, we developed a custom photometric redshift model named CBPF-zphot2. This novel approach allowed tailored estimation and greater control over the redshift modelling process described as follows.
Our photometric redshifts re-estimations were obtained using mixture density networks (MDNs; Bishop 1994), which are neural networks combined with a parametric mixture model (McLachlan et al. 2019; Yu et al. 2010), which in our case outputs a Gaussian mixture distribution. The network architecture was developed based on methods proven effective in previous photo-z studies (Teixeira et al. 2024; Lima et al. 2022). Motivated by the absence of faint (18.5 < mr < 20.5) low-mass cluster galaxies at z < 0.07 in the training sets used by LS-DR9 and LS-DR10, resulting in an observed galaxy cluster candidate members under-density in the red sequence faint end (as shown by the LS-DR9 and LS-DR10 photo-z selection: see Section 3), architecture to separately process colours and magnitudes using dedicated dense layers. These were then combined through a late concatenation step, followed by additional dense layers and a Gaussian mixture output (illustrative diagram provided in Figure A.1). This architectural improvement led to a significantly more populated faint red sequence, consistent with results from S-PLUS zphot, known for its enhanced redshift accuracy due to richer photometric information. We refer to Section 3 for a comparison between our internal photo-z estimations (LS-DR10-CBPF) with LS-DR9 and LS-DR10 public photo-z.
The model was trained using magnitudes and colours from the LS-DR10 dataset, while the reference spectroscopic redshifts used to train and evaluate the model were obtained from a cross-match between LS-DR10 and the Southern-Hemisphere Spectroscopic Redshift Compilation (de Lima 2024); further details regarding the spec-z compilation are provided in Section 2.4. To construct a reliable training sample, we selected galaxies based on the star–galaxy separation (cat[’type’] != ’PSF’) already described in Section 2.1. We then applied the following criteria to ensure high-quality photometry and to remove unphysical colours:
-
mg < 24.0,
-
mr < 23.0,
-
mi < 23.0,
-
mz < 22.5,
-
mW1 < 25,
-
mW2 < 25,
-
−1 < mg − mr < 4,
-
−1 < mr − mi < 4,
-
−1 < mi − mz < 4,
-
0.01 < zspec < 1.
The global magnitude cuts exclude very faint galaxies, low-significance detections, and spurious sources, reflecting the intrinsic limitations of the instrument. Although these thresholds are relatively generous, only a small number of objects lie close to these limits because we also applied a signal-to-noise criterion (S/N > 2 in the griz bands) when constructing the training sample. In addition, color cuts defined in an agnostic way to remove sources with unphysical colours (Drlica-Wagner et al. 2018). After these cuts, we reserved 10% of the resulting catalogue as a test sample to validate the performance of the model on unseen data. From the remaining dataset, we constructed our training sample by randomly selecting objects to achieve a uniform spectroscopic redshift distribution up to zspec = 1, mitigating potential biases towards over-represented redshift values in the training set. This upper limit does not affect the performance at lower redshifts, but it helps reduce systematic biases at higher redshifts (as demonstrated in Teixeira et al. 2024).
The inputs to our MDN model included magnitudes from the g, r, i, z, W1, and W2 bands, along with all possible derived colours. The network was trained to output probability density functions with peaks aligned to the spectroscopic redshift values.
To ensure maximal coverage, we trained independent models for different combinations of missing bands. Most clusters contain at least 80% of objects with complete photometric coverage, that is, reliable measurements in all six bands: g, r, i, z, W1, and W2. The model trained using this full set of bands is labelled GRIZW1W2. To handle sources with incomplete data, we also trained additional models by omitting selected bands(using the same architecture and training set, but with different magnitude inputs), resulting in the GRIZ, GRI, and GRZ labelled models. A similar approach was adopted in Teixeira et al. (2024). As expected, in our case, the best results were obtained with the GRIZW1W2 model. Since this configuration covers the vast majority of objects in our sample, all reported metrics throughout this work refer to this model unless stated otherwise.
Our improved photometric redshift model achieved a median bias, (δz)CBPF = +0.008, scatter  , and ηCBPF = 0.05; specifically, for test sample objects within 0 < zspec < 0.3 and 18.5 < mr < 20.5 (mag). Here, δz = zphot − zspec is the bias of the photometric redshift estimate, σNMAD is the normalised median absolute deviation (see Section 3 for details), and η is the outlier fraction of the zphot estimates (i.e. the fraction of galaxies with ∣δz ∣ /(1 + zspec) > 0.15). For comparison, the corresponding values for the public LS-DR10 photometric redshifts give a median bias of (δz)LS − DR10 = 0.014,
  for the scatter, and ηLS − DR10 = 0.19.
The systematic uncertainties, σz, of the photo-z arise from dataset limitations (e.g., signal quality, depth) and can be estimated from the 68% credible intervals of the PDFs for each object. These intervals were released along with the public LS-DR10 photometric redshifts while the LS-DR10-CBPF intervals were obtained from our photo-z estimations. We find an averaged σzCBPF = 0.044 and σzLS − DR10 = 0.145, demonstrating the improved precision of our novel estimates.
The overall accuracy metrics and uncertainties for the complete test set up to magnitude 20.5 are shown in Table A.1. Thus, the novel CBPF-zphot estimates demonstrate comparable accuracies to the public LS-DR10 values while notably enhancing the physical interpretability of colour-magnitude diagrams (CMDs), particularly in the context of our target selection, and significantly improving photo-z quality for fainter objects at low-redshifts. Additional details on the full LS-DR10-CBPF photometric redshift estimations can be found in (Teixeira et al., in prep.).
2.3. T80S/S-PLUS
The Southern Photometric Local Universe Survey (S-PLUS) footprint covers around 9300 square degrees of the sky, utilising a robotic 0.83 m telescope (T80-South, hereafter T80S) based at the Cerro Tololo Inter-American Observatory (CTIO) in Chile. This telescope is equipped with the T80Cam, featuring a detector of 9232 × 9216 10 μm-pixels, providing a field of view of approximately 2 square degrees and a pixel scale of 0.55 arcseconds.
S-PLUS employs the Javalambre 12-filter photometric system (Cenarro et al. 2019), which consists of five broad-band filters (u, g, r, i, z) and seven narrow-band filters(J0378, J0395, J0410, J0430, J0515, J0660, J0861), designed to coincide with, respectively, the [O II], Ca H + K, H δ, G band, Mg B triplet, H α, and Ca triplet features. While originally tailored for stellar classification, the system’s spectral coverage also enables detailed analyses of galaxies and planetary nebulae. The J0660 narrow-band filter is centered at λ6614 Å, allowing it to capture both H α and the [N II)] λλ6548–6584 Å emission lines for objects with redshifts up to ∼0.02.
We collected our T80S/S-PLUS datasets from the DR4 & iDR5 S-PLUS datasets and our own CHANCES-T80S observational programmes CN2020B-30 and CN2022B-77 (PIs Y. Jaffé and C. Sifón); hereafter, we refer to them as T80S/S-PLUS. The CHANCES-S-PLUS datasets followed the DR4 & iDR5 photometric data reduction and photometric redshift estimations, fully described in Herpich et al. (2024) and Lima-Dias et al. (in prep.), respectively, following the standard S-PLUS data reduction and calibration (Schwarz et al. 2025; Almeida-Fernandes et al. 2022). In particular, the S-PLUS photometric redshift estimations include a single-point estimations (SPEs) and probability distribution functions (PDFs) based on galaxy spectroscopy for all objects. These estimates were obtained using a supervised machine learning algorithm based on a Bayesian mixture density network model. More details can be found in Lima et al. (2022). A global overview of the S-PLUS main survey including the instrumentation, strategies and goals can be found in Mendes de Oliveira et al. (2019). We crossmatch S-PLUS catalogues with their LS-DR10 counterparts to produce homogenous tables with GAIA astrometric information and LS-DR10 photometry, only keeping the S-PLUS zphot, which we used to select our galaxy cluster candidate members.
The green regions in Figure 1 indicate the clusters covered by the S-PLUS DR4 main survey footprint, while the purple ones correspond our dedicated CHANCES-T80S observational campaigns. Table C.1 summarises the T80S/S-PLUS coverage of our Low-z cluster sample. The T80S/S-PLUS data represents a 55% of our CHANCES Low-z data, with 35 out of the 50+2 clusters (∼67%) having partial T80S/S-PLUS coverage. Only 9 clusters, ∼17% of the entire Low-z sample, are fully covered out to 5 × R200 with T80S/S-PLUS data.
To compare the galaxy cluster candidate members selected by adopting different zphot estimates coming from T80S/S-PLUS and LS-DR9, LS-DR10, and LS-DR10-CBPF, we considered six clusters that are completely covered out to 5 × R200 by T80S/S-PLUS and have a good spectroscopic coverage down to mr = 20.4(A0500, A0957, A1631, A2717, A3223, and A3809), and complemented by clusters (A2399, A3490, A0780, A1644, A3266, A3376, A3667, A0085, A3716, and A2415) with a T80S/S-PLUS coverage higher than 80% alongside a good zspec coverage in the faint end (18.5 < mr < 20.4). The complete list of targets used for the target selection in this work (including both S-PLUS data and CHANCES-T80S observations) is available at the archival section of the S-PLUS database splus.cloud3.
2.4. Spectroscopic redshifts
Many of the regions targeted have been observed by spectroscopic surveys before. We used spectroscopic information from the literature to discard galaxies outside the redshift range we are considering and also to assess the completeness and purity of our photometric target selection. For this task, we used the Southern Hemisphere Spectroscopic Redshift Compilation (de Lima 2024). This compilation was created with the goal of establishing a basis for photometric redshift models (Lima et al. 2022) to be used in the S-PLUS survey (Mendes de Oliveira et al. 2019), covering the entire sky below the declination of +10°.
The current version of this compilation contains over 5000 catalogues from different sources, such as VizieR4, High Energy Astrophysics Science Archive Research Center (HEASARC)5, NASA/IPAC Extragalactic Database (NED)6, Sloan Digital Sky Survey’s eighteenth data-release (Almeida et al. 2023), and others. Since some catalogues contain duplicated information, so we applied a duplicate removal procedure, with the number of catalogues used for the objects that remain standing at 1852. The total number of objects is 8437460, of which 2548065 are galaxies, 4812282 are stars, and 507894 are quasars. The catalogue is publicly available7 and includes the full reference list of catalogues used.
A direct comparison of the zphot coming from T80S/S-PLUS, LS-DR9, LS-DR10- and LS-DR10-CBPF-zphot against zspec, by considering 16 clusters well covered by zphot T80S/S-PLUS, LS-DR10 and LS-DR10-CBPF is shown in Figure 2. We find that, the mean spectroscopic and photometric redshift difference: ⟨δz⟩=⟨|zspec − zphot|⟩ is ⟨δz⟩ = 0.013 ± 0.019 if we consider all the combined target selection adopted for bright galaxies (mr < 18.5; see Sect. 3) using zphot estimations from T80S/S-PLUS, LS-DR9, LS-DR10 and LS-DR10-CBPF. If we then inspect this difference for each zphot independently, we find that δz is 0.009, 0.011, 0.012, and 0.013 with Spearman correlation coefficients (ρ) of 0.57, 0.53, 0.58, and 0.53 for T80S/S-PLUS, LS-DR9, LS-DR10 and LS-DR10-CBPF, respectively.
 |
Fig. 2. Comparison between photometric (zphot) and spectroscopic(zspec) redshifts for each of the photo-z sets used in this work, from left to right T80S/S-PLUS, LS-DR9, LS-DR10, and LS-DR10-CBPF. Coloured symbols correspond to the bright (mr < 18.5) galaxy cluster candidate members belonging to 16 clusters with good spatial and zspec coverage for all surveys. |
3. Cluster membership and target selection strategy
We used all the photometric information and zphot available (described in the previous section) to select candidate cluster members whose photometric redshifts are consistent with being at the known redshift of the cluster. To do so, we first need to measure the average deviations of the photometric redshifts with respect to the spectroscopic redshift measurements ⟨σNMAD⟩ in 0.2 mag bins of r-band magnitude, using the normalised median absolute deviation as a robust measure of the uncertainties, where σNMAD is defined as
 (1)
(1)
where zphot is the photometric redshift and δz = (zphot − zspec) is its bias. Brammer et al. (2008) showed that σNMAD is robust, with low sensitivity to outliers, gradually increasing for fainter magnitudes. We then fit a third-order polynomial function to the average normalised median absolute deviation(refer to Section 5 to see the best-fit values), which assess the quality of the zphot estimates ⟨σNMAD⟩) per mr-bin for T80S/S-PLUS and LS photometric redshifts individually, as shown in Figure 3.
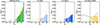 |
Fig. 3. σNMAD curves used to select the most likely galaxy cluster candidate members for the Low-z-CHANCES target catalogues for each set of photometric redshifts: T80S/S-PLUS (green), LS-DR9 (light-blue), LS-DR10 (blue) and LS-DR10-CBPF (yellow). The curves were obtained through a polynomial fit on the σNMAD histogram with equally log(mr) sized bins for each of the zphot training sample (see Section 3 for details), dashed lines indicate the mr-limit at which a constant value was adopted for selecting the cluster galaxy candidate members. These curves evidence the differences in mr distributions of the different training samples used to determine zphot. |
Using these curves, we can now select galaxy cluster candidate members considering galaxies with photometric redshifts within the mean cluster redshift (zcl) considering a given error range. In other words: |zphot − zcl|< N × σNMAD, where N can be adjusted according to the data set to maximise completeness. Note that we assume a constant value of N × σNMAD for objects brighter than mr ≲ 16.5 to include spectroscopic confirmed bright galaxy cluster members from the T80S/S-PLUS datasets. Correspondingly, for consistency we assumed a similar constant value for the adopted LS selection functions.
To illustrate our galaxy cluster candidate member selection process, we make use of Abell 85 T80S/S-PLUS, LS-DR9, LS-DR10, and our LS-DR10-CBPF zphot available. Figure 4 shows the corresponding parent samples in grey symbols, blue symbols correspond to the photometrically selected objects, while yellow open symbols correspond to photometric selected objects with known spectroscopically redshift determinations(zspec). Figure 4 shows the striking differences among the zphot used in this work, while T80S/S-PLUS assigns photo-z values as high as zphot ≲ 0.2, LS-DR9 -DR10 and -DR10-CBPF zphot only reach zphot ≲ 0.15, caused by the different selection functions shown in Figure 3. These variations are more evident at lower mr ≥ 18.5 where spectroscopically confirmed cluster members and cluster candidate members with known spectroscopic redshift lying within the |zcls|< σ range are missed by our z-phot selection method. LS-DR9 and LS-DR10 photo-z estimations miss twice the spectroscopic objects missed by S-PLUS, while our LS-DR10-CBPF zphot recovers most of them.
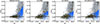 |
Fig. 4. Photometric redshift as a function of r-band magnitude for each set of photometric redshifts, from left to right: T80S/S-PLUS, LS-DR9, LS-DR10, and LS-DR10-CBPF. We include the corresponding parent sample (grey circles), the A0085 galaxy cluster candidate members selected from our photometric method (blue), the spectroscopically confirmed members (yellow circles), and the confirmed spectroscopic cluster members and spectroscopic objects within the cluster redshift range (yellow crosses) that were not selected by our method. The solid black line indicates the cluster redshift obtained from the mean spectroscopic redshift distribution, while the dashed lines indicate the cluster spectroscopic redshift lower and upper limits. The bright-faint boundary at mr = 18.5 is indicated by a vertical dotted line. Adopting different zphot with their corresponding σNMAD curves lead to a different cluster galaxy candidate members selection, specially at fainter magnitudes (mr ≥ 18.5), where S-PLUS selects more candidates as compared with –zphot. |
Figures 5 and 6 show the corresponding zphot − zspec and the CMDs, respectively. All four datasets show a similar redshift distribution, ranging values between zspec = 0.02. and 0.07, where most of the selected objects are located around the cluster redshift at z = 0.056. Spectroscopic objects out of this range correspond to selected objects from the σNMAD curve-fit and strictly depend on the zphot adopted. However, when we consider the CMDs, we notice some striking differences in the faint-end regime at magnitudes fainter than mr ≥ 18.5. While T80S/S-PLUS selects objects that completely cover the faint end including objects redder than mg − mr ≥ 1.0, LS-DR9- and LS-DR10-zphot show an under-density of faint-red objects (mg − mr = 0.5 − 0.9 and mr ≥ 18.5), regardless of the excellent coverage of confirmed spectroscopic objects. This motivated our internal CBPF zphot determinations from the LS-DR10 photometric datasets. Figure 7 shows that adopting the different available zphot result in an target selection homogenously distributed within 5 × R200. We note that although Figures 5 and 6 shows a good coverage of spectroscopic objects in all the magntiude range and specially in the faint-red-end (magr ≥ 18.5) for Abell-85, 50+2 CHANES-Low-z clusters. Most of our clusters have a scarce spectroscopic coverage at fainter magnitudes, which directly impacts the training datasets to determine the photozs. The low spectroscopic coverage at fainter magnitudes is one of the main motivations for proposing the CHANCES survey: to explore this regime and populate it with good-quality spectra.
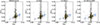 |
Fig. 5. Photometric redshift versus spectroscopic redshift for each set of photometric redshifts, from left to right: T80S/S-PLUS, LS-DR9, LS-DR10 and LS-DR10-CBPF. We include the corresponding parent sample (grey circles), the A0085 galaxy cluster candidate members selected from our photometric method (blue), the spectroscopically confirmed members (yellow circles), and the confirmed spectroscopic cluster members and spectroscopic objects within the cluster redshift range (yellow crosses) that were not selected by our method. The solid black vertical-line indicates the cluster redshift obtained from the mean spectroscopic redshift distribution, while the dashed vertical-lines indicate the cluster lower and upper limits. |
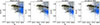 |
Fig. 6. CMD for each set of photometric redshifts from left to right: T80S/S-PLUS, LS-DR9, LS-DR10 and LS-DR10-CBPF. We include the corresponding parent sample (grey circles), the A0085 galaxy cluster candidate members selected from our photometric method (blue), the spectroscopically confirmed members (yellow circles), and the confirmed spectroscopic cluster members and spectroscopic objects within the cluster redshift range (yellow crosses) that were not selected by our method. The bright-faint boundary at mr = 18.5 is indicated by a vertical dotted line. The different CMDs evidence the out-striking differences of the selected cluster galaxy candidate members, specially at fainter magnitudes (mr ≥ 18.5), where only T80S/S-PLUS- and LS-DR10-CBPF-zphot effectively populate the red faint regime (mg − mr > 0.5). |
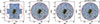 |
Fig. 7. Spatial distribution of the A0085 galaxy cluster candidate members using our target selection process for the four different parent catalogues used, from left to right: T80S/S-PLUS, LS-DR9, LS-DR10 and LS-DR10-CBPF. We include the corresponding parent sample(grey circles), the A0085 galaxy cluster candidate members selected from our photometric method (blue), the spectroscopically confirmed members (yellow circles), and the confirmed spectroscopic cluster members and spectroscopic objects within the cluster redshift range (yellow crosses) that were not selected by our method. The cluster galaxy candidate members of the four different zphot are homogeneously distributed and any significant differences are appreciated. |
To compile the final versions of the CHANCES low-redshift catalogues, we tested different values of N for T80S/S-PLUS and LS zphot. In particular we tested the effects of adopting different mr-limits in the range 20.1-20.5 and adopting N × σNMAD combinations: 3.5/3.0, 3.5/2.5, 3.0/2.5, and 3.0/2.0 for T80S/S-PLUS and LS-DR10-CBPF (see Figure 8) We find that the total number of selected objects (NT) declines as a function of mr, if mr = 20.5 is considered NT is reduced to 60% at mr-limit = 20. Moreover, independent of mr-limit adopted, NT declines from assuming N × σNMAD = 4 for both zphot -T80S/S-PLUS and -LS-DR10-CBPF to adopting different N × σNMAD combinations, by dropping down to a ≲60% of the selected objects at N × σNMAD-combination: 3.0, 2.0 for -T80S/S-PLUS and -LS-DR10-CBPF, respectively.
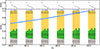 |
Fig. 8. Total number of selected objects (NT) for the faint-end (mr ≥ 18.5) regime by adopting different N × σNMAD combinations for T80S/S-PLUS and LS-DR10-CBPF galaxy cluster candidate members selection and imposing different mr-limit values (20, 20.1, 20.2, 20.3, 20.4 and 20.5). The lower panel show a set of 5 different N × σNMAD combinations within the mr range of 20-20.5. The leftmost column of each set corresponds to target selections adopting N × σNMAD = 4 for both T80S/S-PLUS and LS-DR10-CBPF, followed by the N × σNMAD combinations (from left to right): 3.5/3.0, 3.5/2.5, 3.0/2.5; and 3.0/2.0 for T80S/S-PLUS and LS-DR10-CBPF respectively. As a reference NT number (NT) of selected objects is included on top of each mr-limited set considering N × σNMAD = 4 for both T80S/S-PLUS and CBPF surveys. The blue line highlights how NT varies as a function of mr, if mr = 20.5 (N/NT = 1) is considered NT is reduced to 60% at mr-limit = 20. Each bar is decomposed by their corresponding parent survey catalogue: T80S/S-PLUS (green), CBPF (yellow) and common objects selected by both surveys(grey). The upper panel shows how the different N × σNMAD adopted combinations for T80S/S-PLUS and LS-DR10-CBPF affect NT at each mr-limit bin, considering N × σNMAD = 4 as a reference (N/NT = 1). At all mr bins the number of objects is reduced for the different N × σNMAD combinations, dropping down to a ≲60% of the selected objects at N × σNMAD-combination: 3.0, 2.0 for T80S/S-PLUS and LS-DR10-CBPF, respectively. The final mr-limit at = 20.4 and N × σNMAD-combination 3.5/T80S/S-PLUS and 3.0/ LS-DR10-CBPF adopted to compile the Low-z faint (S1505) and Low-z faint suplementary (S1506) catalogues is highlighted in red. |
Given the tendency to obtain higher S/N for galaxies with mr < 18.5 and the fact that in that regime, the photo-zs for selecting targets perform best, we split our Low-z sub-survey at this magnitude limit. Additionally, we further divided the faint end (galaxies with mr ≥ 18.5) into two sub-surveys. We ended up with three Low-z sub-surveys: S1501, S1505, and S1506, each with different membership selection strategy8.
In particular, we adopted the following restrictions:
-
Low-z bright (S1501): bright (mr < 18.5) photometric members according to T80S/S-PLUS photometric redshifts, considering a threshold of N × σNMAD = 3.5, and/or photometric members according to public photometric redshifts from LS-DR9 and/or LS-DR10 (N × σNMAD = 3), and in addition, galaxies that are considered members according to our custom made photometric redshifts CBPF (σNMAD = 3) and zspec < 0.1.
-
Low-z faint (S1505): Faint (18.5 ≤ mr < 20.4) photometric members considering photometric redshifts from T80S/S-PLUS when available (N × σNMAD = 3.5) and/or our custom-made photometric redshifts CBPF (N × σNMAD = 3) and zspec < 0.1.
-
Low-z faint suplementary (S1506): To ensure a high completeness of faint red galaxies, we also create a subset of galaxies equal to the Low-z faint sample with added red sequence galaxies not selected by our photometric redshifts (see Section 3.3) (CBPF) meaning: S-PLUS + Legacy-CBPF (+ Red Sequence)
The CHANCES-low-redshift sub-surveys presented in this work have been compiled using the EECHOz9 code (Méndez-Hernández et al. 2025). Figure 8 shows a detailed comparison of the faint-end regime (mr ≥ 18.5) by combining different N × σNMAD values for T80S/S-PLUS- and CBPF-zphot and different mr upper-limits within the mr-range 20–20.5. After comparing the total number of objects selected for different values of N, we decided to adopt N = 3.5 for T80S/S-PLUS and N = 3 for all LS photometric redshifts. This combination of values provides the best compromise between the (minimum) number of objects selected and a high spectroscopic redshift completeness. Figure 9 shows the total number of selected objects (upper panels) and the fraction of the selected spectroscopic confirmed members (lower panels) by adopting different N × σNMAD values. Larger N × σNMAD values results in a larger number of photometric selected objects and a smaller fraction of lost spectroscopic confirmed members that are not being selected, while smaller N × σNMAD values results in a smaller number of photometric selected objects with a larger fraction of lost spectroscopic confirmed members that are not being selected. The first panel shows how this affects our bright(mr < 18.5) in blue) and faint (mr ≥ 18.5) in red) catalogues, the middle and right panels show a direct comparison between T80S/S-PLUS- and CBPF-zphot estimations by considering all the clusters with any T80S/S-PLUS coverage (middle) and by considering those clusters (N = 16) with good T80S/S-PLUS coverage (> 80%). For all the N × σNMAD adopted values, T80S/S-PLUS selects more objects than CBPF. The former allow us to define the final N × σNMAD adopted values to fit the total number of selected objects with the 4MOST fiber/hours allocated to CHANCES.
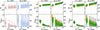 |
Fig. 9. Number of galaxy cluster candidate members selected photometrically (top) and the fraction of lost spectroscopically confirmed members normalised to N × σNMAD = 1 (bottom) as a function of N × σNMAD considering the CHANCES low-redshift magnitude-limited regimes: bright end (mr < 18.5, red) and faint end (mr ≥ 18.5, blue). Assuming N × σNMAD = 4 our target selection process selects the largest number of galaxy cluster candidate members with the lowest fraction loss of spectroscopic members, while assuming N × σNMAD = 1 we select the lowest number of galaxy cluster candidate members, with the highest fraction of lost spectroscopically confirmed members. The first panel shows this by considering only our internal LS-DR10-CBPF-zphot estimations, while the middle and right panels show a direct comparison between LS-DR10-CBPF- and S-PLUS-zphot, considering 10 clusters with good T80S/S-PLUS coverage (middle panel) and an extended sample considering 16 clusters with T80S/S-PLUS coverage >80%(rightmost panel); see Section 2.3 for details. Assuming N × σNMAD = 3.5 and 3 for S-PLUS and LD-DR10-CBPF-zphot, respectively, successfully reduces the total number of the galaxy cluster candidate members selected with a spectroscopic members loss of ∼2 − 3%. |
In all cases, galaxies with known spectroscopic redshifts (Section ) outside the range ±3σ of the CHANCES-Low-z subsurvey redshift were excluded. Figure 10 summarises the different restrictions adopted to build our three CHANCES-Low-z catalogues, as well as the final number of target members selected for each of the three Low-z catalogues. We note that assuming a magnitude limit of mr = 20.4, the 4MOST f.o.m. (0.5) and the corresponding completenesses for S1501 (84.1%), S1505 (65%) and S1506 (10%), we expect to observe 320 000 objects within the CHANCES-low-redshift sub-survey. We describe each sub-survey selection strategy in the following.
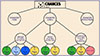 |
Fig. 10. CHANCES-Low-z photometric selection diagram showing the different survey datasets used to compile the Low-z bright (S1501), Low-z faint (S1505) and Low-z faint supplementary (S1506). The T80S/S-PLUS, LS-DR9, LS-DR10 and LS-DR10-CBPF datasets are shown in green, cyan, blue and yellow, the red circle represents the ±1σ red sequence selected objects. |
3.1. Low-z bright (S1501)
For galaxies with mr < 18.5 all the available photometric redshifts perform well. Thus, to maximise completeness and to preserve homogeneity (particularly with the selection on the faint end, see Section ), we consider galaxies to be galaxy cluster candidate members if any of their photometric redshifts coincide with the cluster redshift within errors. The errors considered are the normalised median average deviation (σNMAD) which increases at fainter magnitudes.
As an example, Figure 11 shows the photometric selection procedure of Abell 500, where we selected 1020 galaxies with T80S/S-PLUS, 934 with LS-DR9, 874 with LS-DR10 and 1032 with LS-DR10-CBPF. The corresponding Figures from LS-DR9, LS-DR10 and LS-DR10-CBPF for Abell 500 can be found in the Appendix 5.
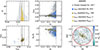 |
Fig. 11. Photometric target selection of Abell 500 for bright objects (mr < 18.5) using T80S/S-PLUS-zphot. grey symbols correspond to the T80S/S-PLUS photometric parent sample, yellow symbols correspond to the spectroscopic objects, while blue symbols correspond to the photometric selected Abell 500 galaxy cluster candidate members. The upper panels show from left to right, the spectroscopic redshift distribution(zspec), the mr − zphot diagram and relevant cluster information including the parent sample, total number of galaxy cluster selected objects, the spectroscopically confirmed cluster members (yellow circles), the confirmed spectroscopic cluster members (open circles), and the spectroscopically confirmed cluster members and spectroscopic objects within the cluster redshift range (yellow crosses) that were not selected by our method. The lower panels show from left to right show the zspec − zphot diagram, along with the CMD and spatial distribution diagram (SDD). |
To assess the completeness of each selection, we consider the fraction of known spectroscopic members in a given cluster (from the literature) that are recovered through the photometric target selection by adopting each of the different zphot. On the other hand we evaluate the purity of our selection by considering the fraction of photometric selected objects that are spectroscopically confirmed as members. Table 1 shows the average completeness and purity of 6 clusters completely covered by T80S/S-PLUS and Legacy surveys with a good spectroscopic coverage down to the faint regime (mr = 20.4). We also include the same values by extending our sample to those clusters (N = 16) with a good T80S/S-PLUS coverage larger than 80% (see Section 2.3). When we combine all photometric redshift selections, their combined completenesses and purities are 0.93, 0.89 and 0.80, 0.83 for S1501 and S1505 respectively.
Completeness and purity values for low- and bright-z sub-surveys.
Finally, Figure C.5 shows the decomposition of the 35 clusters with any T80S/S-PLUS coverage from S1501 selection, clusters completely covered (5 × R200) by T80S/S-PLUS are delimited by a blue-solid line, while those clusters with good T80S/S-PLUS coverage(≥80%) are indicated by a blue-dashed line. The green region corresponds to the fraction of objects selected by adopting T80S/S-PLUS-zphot, the light-blue region corresponds to objects selected by adopting LSDR9-zphot, the light-blue region corresponds to objects selected by adopting LSDR10-zphot, the yellow region corresponds to the fraction of objects selected by adopting CBPF-zphot and the grey region corresponds to the fraction of selected objects in common. This decomposition shows that the highest fraction (≥48%) of selected objects corresponds to those who are selected by two or more surveys, followed by those objects selected independently by adopting T80S/S-PLUS (≤43%) and LS-DR10-CBPF (≤20%). Objects exclusively selected by adopting LS-DR9- and LS-DR10-zphot show the lowest contribution (≤10%) to our S1501 sub-survey.
3.2. Low-z faint (S1505)
For galaxies with 18.5 ≤ mr < 20.4 mag the photometric redshifts generally have more difficulties selecting potential galaxy cluster candidate members. As discussed before in Section 3 and shown in Figure 6, the public LS-DR10 zphot under-selects faint red galaxies in clusters. Instead, T80S/S-PLUS photometric selection performs better in this regime, however only 6 clusters of CHANCES-Low-z cluster sample are completely covered out to 5 × R200, as mentioned in Section 2.3.
For homogeneity, we developed our own zphot estimations (CBPF) using the available LS-DR10 photometric information (see Section 2.2), which largely alleviate the red faint end under-selection issue (see Figure 6). As a result, for the faint end, we only used a combination of our CBPF- and T80S/S-PLUS-zphot when available to select targets, using the same strategy and N values as for the bright end for homogeneity. Figure C.6 shows the decomposition of the 35 clusters with any T80S/S-PLUS coverage from S1505 selection, clusters completely covered (5 × R200) by T80S/S-PLUS are delimited by a blue-solid line, while those clusters with good T80S/S-PLUS coverage(≥80%) are indicated by a blue-dashed line. The green region corresponds to the fraction of objects selected by adopting T80S/S-PLUS-zphot, the yellow region corresponds to the fraction of objects selected by adopting CBPF-zphot and the grey region corresponds to the fraction of selected objects in common. If we consider only the 6 clusters with spatial and spectroscopical coverages, we find that ∼45% and ∼28% where selected exclusively by T80S/S-PLUS and CBPF respectively, while the remaining ∼27% of the targets were selected by both of them. Finally, the individual completeness reached by both zphot is shown in second row’s right columns of Table 1.
3.3. Low-z faint suplementary (S1506): Adding the red sequence
While CBPF-zphot improved the target selection in the red faint end of the CMD significantly compared to the LS-DR10-zphot, the very faint end (mr ≳ 19.5) of the red sequence still presents lower target densities. To overcome this issue, we fit the red sequence using five equally sized mr bins (Δmr = 0.9), spanning the full magnitude range of the CMD (15.5 ≤ mr ≤ 20.5). To perform the fit, we considered all previously selected photometric members located within 0.75 × R200 and within the colour range 0.6 ≤ mg − mr ≤ 1.2, in order to ensure a proper fit based on the most likely galaxy cluster candidate members. We then applied a supervised one-component Gaussian Mixture Model (GMM, Pedregosa et al. 2011) to the colour distribution to determine the mean mg − mr value in each magnitude bin (see right panles of Figure 12). Using the five mean values obtained from the GMM, we performed a linear regression to fit the red sequence (see left panel of Figure 12), to include galaxies within ±1 × σ of the linear fit. The left panel of Figure 12 shows the red sequence fit on the CMD for Abell 85, indicating in different colours the magnitude bins considered to do the red sequence fit. The right panels of Figure 12 show the colour distribution for each bin, along with the corresponding Gaussian fit and its mean value. For clusters with a spectroscopic sample that spans the full magnitude range of the CMD, from the bright to the faint end, and/or includes more than 120 spectroscopically confirmed members, we applied a similar red sequence fitting procedure, considering only the spectroscopic members. We fitted two gaussians in four magnitude bins to separate the blue cloud from the red sequence, and performed the fit using only the mean of the red sequence galaxies.
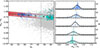 |
Fig. 12. Red sequence fit from the CMD for Abell 85. The left panel shows the CMD, the grey points correspond to the galaxy cluster candidate members selected by our photometric method, the open coloured symbols show the colour-range bins used to fit the red sequence, yellow stars correspond to the mean mg − mr colour in each bin obtained from a gaussian fit, while the best fit is shown with a black solid line including the ±1σ region in red and delimeted by dotted lines. The dashed line indicates the bright-faint boundary at mr = 18.5. The right panel shows the mg − mr bins distributions, overlaid in black lines show the best guassian fit for each distribution while the dashed lines indicated the mean average mg − mr colour. |
Figure 13 shows the photometric target selection of Abell 500 for the faint end (S1505) and faint end + red sequence selected objects (S1506). The objects selected from the red sequence fit described above are shown in magenta symbols, where can be easily identified in the CMD panel filling the under-dense region partially filled by our CBPF-zphot estimations and that are homogeneously distributed within 5 × R200.
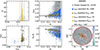 |
Fig. 13. Photometric target selection of Abell 500, using CBPF-zphot, including the red sequence objects. The red-faint objects from S1506 completely fill the under-dense region in the faint-red-end and are homogenously distributed out to 5 × R200. Similar as Figure 11 symbols represent the parent sample, spectroscopic objects and the photometric selected Abell 500 galaxy cluster candidate members in grey, yellow and blue respectively. We now include in magenta symbols the faint-red objects added through the faint-red sequence fit (see Section 3.2 for details). The upper panels show from left to right, the spectroscopic redshift distribution(zspec), the zphot − mr diagram and relevant cluster information including the parent sample, total number of galaxy cluster selected objects, the confirmed spectroscopic cluster members (open circles), and the spectroscopically confirmed cluster members and spectroscopic objects within the cluster redshift range (yellow crosses) that were not selected by our method. The lower panels show from left to right the zspec − zphot diagram, along with the CMD and SSD. The red sequence-fit selected objects successfully fill in the faint-end, under-dense region and are homogenously distributed within 5 × R200. |
The Low-z faint sub-survey (S1505), includes faint targets with an efficient selection, it posseses a high completeness criteria, and was compiled with a target selection criterion focused on selecting the most likely galaxy cluster candidate members. On the other hand, the Low-z faint supplementary sub-survey (S1506), samples all possible targets with the most complete selection. It has a relaxed target selection criterion to make sure that all putative member galaxies have a chance to be observed. In this way, S1506 can be used to infer the statistics of rare galaxies based on the actual sampling rate, as although the S1506-zspec follow-up is low, it is not weighting down any galaxy SED. Moreover, S1506 contains S1505 as a way to test the zphot errors by assessing whether a sampling targeting all galaxies is achieved or not.
3.4. Fornax target selection
The Fornax cluster proved to be the most challenging system in the Low-z sample for the target selection. It is the nearest cluster in the Southern hemisphere at a distance of just 20 Mpc (z = 0.005). Even though it is the least massive cluster in our sample, this proximity results in a virial radius of 1.8 degrees, which is four to five times larger than the median R200 value in our Low-z sample. Similarly to Antlia, zphot could not be used to select Fornax galaxy members, as they are unreliable at this redshift(z ∼ 0.005). Thus, a CMD approach for selecting their galaxy members was adopted making use of the LS-DR10 photometric information (Lima-Dias et al., in prep.).
Applying the same target selection criteria to the Fornax cluster for the S1505 faint sub-survey resulted in an excessively large number of targets, most of which we expect to be background sources, and so we implemented additional cuts to bring the number of targets down to a reasonable level. First we excluded objects with mg − mr colours more than 1σ above the cluster red sequence and also tightened the photometric redshift criteria, retaining only galaxies with zphot < 0.14. However, the key difference for the Fornax cluster sample is that we reduced the magnitude limit from mr = 20.4 to mr = 20.0.
4. Validation of the CHANCES-Low-z target catalogues for galaxy evolution studies: Tracing global and local galaxy environment
As an example of how these target catalogues can be used for different scientific projects, we present one of its applications to derive the global and local galaxy environment of one of the CHANCES clusters.
The photometric catalogues from the CHANCES target selection strategy described in this work can be used to characterise the large-scale structure (LSS) around the clusters and superclusters (see Baier-Soto et al. 2025), as well as the local environment and substructures (Piraino-Cerda et al., in prep.), to determine the influence of the environment at different scales on galaxy properties as well as galaxy clusters properties.
To demonstrate that the cluster memberships based in photometric members are good enough to trace large and smaller-scale structure, we performed a characterisation of the cluster A3376, identifying cosmic filaments and substructures within a region of 5 × R200 around the cluster centre. For the identification of cosmic filaments we used the Discrete Persistence Structures Extractor (DisPerSE10; Sousbie 2011). We implemented DisPerSE in two dimensions, considering as input the photometric members coordinates. We assumed a persistence threshold of 3σ. For the computation of the local galaxy density, we used the classification technique k-nearest neighbours (KNN). For the computation of the local galaxy density, Σk, we also used the KNN method. Muldrew et al. (2012) showed that this method is more efficient to evaluate local environments, using an appropriate small value such as k = 5. To correct for the lack of completeness and Malmquist bias, we implemented a selection function ψ(z), which depends on the redshift distribution (Lopes-Silva et al. 2025). We ran the KNN as a function of the projected positions of the galaxies and their photo-z, and spec-z results (when available). For the identification of substructures we used the Hierarchical Density-Based Spatial Clustering of Applications with Noise (hereafter HDBSCAN) clustering algorithm technique, which is based on densities (Campello et al. 2015). We implemented HDBSCAN in two dimensions using projected positions assuming a minimum substructures members of 5.
Figure 14 shows the cosmic filaments and substructures detected in Abell 3376, as well as the X-ray emission observed by the extended ROentgen Survey with an Imaging Telescope Array (eROSITA Merloni et al. 2024).
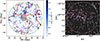 |
Fig. 14. Left panel: LSS and substructures identification in A3376. Blue colour bar shows the local galaxy density with KNN of photometric members that are part of the cluster. Yellow squares are the spectral members. The identified filaments are represented as red lines, where nodes are indicated as black dots. Green circumference is 5 × R200. Magenta contours are eROSITA large-scale X-ray detections in the cluster area. The identified substructures are plotted with different colours. Right panel: RGB cutout of A3376 the central region (0.5 × R200, dashed circle ), overlaid their corresponding galaxy cluster candidate members from S1501 (blue open plus symbols), S1505 (red open cross symbols) and the brightest cluster galaxy (BCG, white star) can be found. |
5. Summary and conclusions
In this paper, we present the target selection methodology for the CHANCES Low-z sub-survey, which is poised to obtain spectroscopic observations of galaxies in and around 50 galaxy clusters and two superclusters at z < 0.07 using the 4MOST instrument. The CHANCES Low-z sub-survey is part of the CHileAN Cluster galaxy Evolution Survey, a 4MOST community survey designed to uncover the relationship between the formation and evolution of galaxies and hierarchical structure formation as it happens, through deep and wide multi-object spectroscopy. The CHANCES-Evolution sub-survey will observe 50 clusters at 0.07 < z < 0.45 with the same magnitude limit (mr ≤ 20.4) and coverage out to 5 × R200, while the CHANCES-CGM sub-survey focuses on QSOs lying behind massive galaxy clusters at z> 0.35, to detect any Mg II absorption associated with galaxy clusters and their surroundings.
We used photometric data from DESI Legacy Imaging Surveys ( LS-DR9, LS-DR10) and T80S/S-PLUS to identify the most likely galaxy cluster candidate members across a wide sky area (r < 5 × R200) and to depths of mr < 20.4. Our selection approach combines photometric redshift estimates with magnitude-dependent redshift uncertainty (σNMAD) criteria. By testing different magnitude limits and N × σNMAD combinations, we found that adopting N × σNMAD = 3.5 for T80S/S-PLUS and N × σNMAD = 3.0 for LS datasets provides an optimal balance between completeness and purity.
To improve completeness at the faint red end of the galaxy population, where public photo-zs tend to underperform, we used the LS-DR10-CBPF photo-z model and supplemented the faint galaxy sample with red sequence-selected galaxies.
Our final target catalogues are organised into three sub-surveys:
-
Low-z Bright: bright galaxies (mr < 18.5) with high photo-z reliability from T80S/S-PLUS, LS-DR9, LS-DR10 and LS-DR10-CBPF;
-
Low-z Faint: faint galaxies (18.5 ≤ mr < 20.4) selected using T80S/S-PLUS and LS-DR10-CBPF photo-zs;
-
Low-z Faint supplementary: the Low-z Faint sample plus a supplementary sample of red sequence galaxies to enhance completeness of faint red galaxy cluster candidate members.
Completeness and purity assessments using available spectroscopic data show that our combined selection strategy recovers over 93% of spectroscopically confirmed members in the bright sample and approximately 89% in the faint sample, across clusters with good photometric and spectroscopic coverage.
Finally, we demonstrated that these photometric catalogues can be used to trace both local and large-scale environments, enabling a wide range of studies on the environmental impact on galaxy evolution. These photometric catalogues will serve as primary input for the spectroscopic follow-up from 4MOST through CHANCES, which will provide ∼500 000 spectra across clusters, groups, and filaments. This combination will enable a robust calibration of the DisPerSE-identified structures, turning projected filaments and substructures into 3D environments traced by redshift-confirmed members. In this way, our catalogues serve as the photometric backbone for the CHANCES spectroscopic programme, while also being compatible with other 4MOST spectroscopic surveys based on Legacy Survey imaging. This ensures that our Low-z catalogues can be seamlessly combined with forthcoming wide-area spectroscopic efforts(e.g. DESI, Euclid, and Rubin/LSST follow-up), thereby maximising their long-term legacy value for studies of galaxy evolution across the cosmic web.
These CHANCES Low-z target catalogues lay a solid foundation for the spectroscopic survey starting soon with 4MOST, which will serve as a legacy resource for environmental and evolutionary studies across a broad range of cluster environments.
Acknowledgments
HMH acknowledges support from the Agencia Nacional de Investigación y Desarrollo (ANID) through Fondecyt project 3230176 and the fruitful discussions with KMGS. HMH, YLJ, CPH, RBS, FPC, EI, VMS and DP gratefully acknowledge financial support from ANID – MILENIO–NCN2024-112. CL-D and AM acknowledges a grant from the ESO Comite Mixto ORP037/2022 and support from the Agencia Nacional de Investigación y Desarrollo (ANID) through Fondecyt project 3250511. AM acknowledges support from the ANID FONDECYT Regular grant 1251882 and funding from the HORIZON-MSCA-2021-SE-01 Research and Innovation Programme under the Marie Sklodowska-Curie grant agreement number 101086388. HMH, AM, YLJ, CS, RD gratefully acknowledge support from the ANID BASAL project FB210003. YLJ and POV acknowledge support from FONDECYT Regular projects 1241426 and 1230441. CPH acknowledges support from ANID through FONDECYT Regular project 1252233. RBS acknowledges support from the Agencia Nacional de Investigación y Desarrollo (ANID)/Subdirección de Capital Humano/Doctorado Nacional/2023-21231017. AVSC, ARL and RFH acknowledge financial support from CONICET, Agencia I+D+i (PICT 2019-03299) and Universidad Nacional de La Plata (Argentina). LSJ acknowledges the support from CNPq (308994/2021-3) and FAPESP (2011/51680-6). STF acknowledges the financial support of DIDULS/ULS through the funding ADI2553855. MAF acknowledges financial support by the Emergia program (EMERGIA20_38888) from the Junta de Andalucía and University of Granada. EI gratefully acknowledge financial support from ANID FONDECYT Regular 1221846. VHLS thanks the support of Coordination for the Improvement of Higher Education Personnel (CAPES). SL and NT acknowledge support by FONDECYT grant 1231187. VMS acknowledge financial support from ESO ORP026/2021. DP acknowledges financial support from ANID through FONDECYT Postdoctorado Project 3230379. FAF acknowledges support from FAPESP grants 2024/00822-5 and 2024/22842-8 MSC acknowledges funding from São Paulo Research Foundation (FAPESP) grant 2023/10774-5. CC acknowledges NSFC grant No. 11803044 and 12173045, the China Manned Space Program with grant no. CMS-CSST-2025-A07 and the Chinese Academy of Sciences South America Center for Astronomy (CASSACA) Key Research Project E52H540301. FRH acknowledges support from FAPESP grants 2018/21661-9 and 2021/11345-5. CMO acknowledges support from FAPESP grant 2019/26492-3. GBOS and GBOS acknowledges FAPESP funding through the TT5 fellowship under process number 2023/03688-5. MJS acknowledges financial support from FAPESP grant 2022/00996-89. LAG-S acknowledges funding for this work from CONICET TSS acknowledge financial support from the São Paulo Research Foundation (FAPESP) through grant 2023/02762-7. BFR acknowledges support from MNiSW grant DIR/WK/2018/12 and grant pl0201-01 at the Poznań Supercomputing and Networking Center. This work has been undertaken in the framework of the 4MOST Collaboration (https://www.4most.eu/cms/home). This work is based on observations collected with the T80-South telescope at CTIO, Chile, under the programme allocated by the Chilean Telescope Allocation Committee (CNTAC), no: CN2020B-30 and CN2022B-77. This work is partially based on data from eROSITA, the soft X-ray instrument aboard SRG, a joint Russian-German science mission supported by the Russian Space Agency (Roskosmos), in the interests of the Russian Academy of Sciences represented by its Space Research Institute (IKI), and the Deutsches Zentrum für Luft- und Raumfahrt (DLR). The SRG spacecraft was built by Lavochkin Association (NPOL) and its subcontractors and is operated by NPOL with support from the Max Planck Institute for Extraterrestrial Physics (MPE). The development and construction of the eROSITA X-ray instrument was led by MPE, with contributions from the Dr. Karl Remeis Observatory Bamberg & ECAP (FAU Erlangen-Nuernberg), the University of Hamburg Observatory, the Leibniz Institute for Astrophysics Potsdam (AIP), and the Institute for Astronomy and Astrophysics of the University of Tübingen, with the support of DLR and the Max Planck Society. The Photometric Redshifts for the Legacy Surveys (PRLS) catalogue used in this paper was produced thanks to funding from the U.S. Department of Energy Office of Science, Office of High Energy Physics via grant DE-SC0007914. The S-PLUS project, including the T80-South robotic telescope and the S-PLUS scientific survey, was founded as a partnership between the Fundação de Amparo á Pesquisa do Estado de São Paulo (FAPESP), the Observatório Nacional (ON), the Federal University of Sergipe (UFS), and the Federal University of Santa Catarina (UFSC), with important financial and practical contributions from other collaborating institutes in Brazil, Chile (Universidad de La Serena), and Spain (Centro de Estudios de Física del Cosmos de Aragón, CEFCA). We further acknowledge financial support from the São Paulo Research Foundation (FAPESP) grant 2019/263492-3, the Brazilian National Research Council (CNPq), the Coordination for the Improvement of Higher Education Personnel (CAPES), the Carlos Chagas Filho Rio de Janeiro State Research Foundation (FAPERJ), and the Brazilian Innovation Agency (FINEP). The S-PLUS collaboration members are grateful for the contributions from CTIO staff in helping in the construction, commissioning, and maintenance of the T80-South telescope and camera. We are also indebted to Rene Laporte, INPE, and Keith Taylor for their essential contributions to the project. From CEFCA, we particularly would like to thank Antonio Marín-Franch for his invaluable contributions in the early phases of the project, David Cristóbal-Hornillos and his team for their help with the installation of the data reduction package JYPE version 0.9.9, César ĺñguez for providing 2D measurements of the filter transmissions, and all other staff members for their support with various aspects of the project. This work made use of Astropy: a community-developed core Python package and an ecosystem of tools and resources for astronomy (Astropy Collaboration 2013, 2018, 2022, http://www.astropy.org). This work has benefited from open-source software including Matplotlib (Hunter 2007, https://matplotlib.org/), NumPy (Harris et al. 2020, https://numpy.org/), SciPy (Virtanen et al. 2020, https://scipy.org/), and Pandas (Pandas Development Team 2020, https://pandas.pydata.org/).
References
- Abolfathi, B., Aguado, D. S., Aguilar, G., et al. 2018, ApJS, 235, 42 [NASA ADS] [CrossRef] [Google Scholar]
- Ahumada, R., Allende Prieto, C., Almeida, A., et al. 2020, ApJS, 249, 3 [NASA ADS] [CrossRef] [Google Scholar]
- Almeida, A., Anderson, S. F., Argudo-Fernández, M., et al. 2023, ApJS, 267, 44 [NASA ADS] [CrossRef] [Google Scholar]
- Almeida-Fernandes, F., SamPedro, L., Herpich, F. R., et al. 2022, MNRAS, 511, 4590 [NASA ADS] [CrossRef] [Google Scholar]
- Astropy Collaboration (Price-Whelan, A. M., et al.) 2018, AJ, 156, 123 [Google Scholar]
- Astropy Collaboration (Price-Whelan, A. M., et al.) 2022, ApJ, 935, 167 [NASA ADS] [CrossRef] [Google Scholar]
- Astropy Collaboration (Robitaille, T. P., et al.) 2013, A&A, 558, A33 [NASA ADS] [CrossRef] [EDP Sciences] [Google Scholar]
- Baier-Soto, R., Jaffé, Y. L., & Finoguenov, A. 2025, A&A, 704, A228 [NASA ADS] [CrossRef] [EDP Sciences] [Google Scholar]
- Bianconi, M., Smith, G. P., Haines, C. P., et al. 2018, MNRAS, 473, L79 [CrossRef] [Google Scholar]
- Bishop, C. 1994, Aston. University, 26 [Google Scholar]
- Brammer, G. B., van Dokkum, P. G., & Coppi, P. 2008, ApJ, 686, 1503 [Google Scholar]
- Byrd, G., & Valtonen, M. 1990, ApJ, 350, 89 [NASA ADS] [CrossRef] [Google Scholar]
- Campello, R. J. G. B., Moulavi, D., Zimek, A., & Sander, J. 2015, ACM Trans. Knowl. Discov. Data, 10 [Google Scholar]
- Cenarro, A. J., Moles, M., Cristóbal-Hornillos, D., et al. 2019, A&A, 622, A176 [NASA ADS] [CrossRef] [EDP Sciences] [Google Scholar]
- Dark Energy Survey Collaboration (Abbott, T., et al.) 2016, MNRAS, 460, 1270 [Google Scholar]
- Dawson, K. S., Schlegel, D. J., Ahn, C. P., et al. 2012, AJ, 145, 10 [Google Scholar]
- Dawson, K. S., Kneib, J.-P., Percival, W. J., et al. 2016, AJ, 151, 44 [Google Scholar]
- De Angeli, F., Weiler, M., Montegriffo, P., et al. 2023, A&A, 674, A2 [NASA ADS] [CrossRef] [EDP Sciences] [Google Scholar]
- de Jong, J. T. A., Verdoes Kleijn, G. A., Boxhoorn, D. R., et al. 2015, A&A, 582, A62 [NASA ADS] [CrossRef] [EDP Sciences] [Google Scholar]
- de Jong, R. S., Agertz, O., Berbel, A. A., et al. 2019, The Messenger, 175, 3 [NASA ADS] [Google Scholar]
- de Lima, E. V. R. 2024, https://doi.org/10.5281/zenodo.15127060 [Google Scholar]
- DePoy, D. L., Abbott, T., Annis, J., et al. 2008, in Ground-based and Airborne Instrumentation for Astronomy II, eds. I. S. McLean, & M. M. Casali, International Society for Optics and Photonics (SPIE), 7014, 70140E [Google Scholar]
- DESI Collaboration (Aghamousa, A., et al.) 2016a, ArXiv e-prints [arXiv:1611.00036] [Google Scholar]
- DESI Collaboration (Aghamousa, A., et al.) 2016b, ArXiv e-prints [arXiv:1611.00037] [Google Scholar]
- DESI Collaboration (Adame, A. G., et al.) 2024, AJ, 168, 58 [NASA ADS] [CrossRef] [Google Scholar]
- Dey, A., Schlegel, D. J., Lang, D., et al. 2019, AJ, 157, 168 [Google Scholar]
- Dressler, A. 1980, ApJ, 236, 351 [Google Scholar]
- Dressler, A. 1984, ARA&A, 22, 185 [NASA ADS] [CrossRef] [Google Scholar]
- Dressler, A., Oemler, A., Jr, Couch, W. J., et al. 1997, ApJ, 490, 577 [NASA ADS] [CrossRef] [Google Scholar]
- Drlica-Wagner, A., Sevilla-Noarbe, I., Rykoff, E. S., et al. 2018, ApJS, 235, 33 [Google Scholar]
- Drlica-Wagner, A., Carlin, J. L., Nidever, D. L., et al. 2021, ApJS, 256, 2 [NASA ADS] [CrossRef] [Google Scholar]
- Fujita, Y. 2004, PASJ, 56, 29 [NASA ADS] [Google Scholar]
- Montegriffo, P. 2023, A&A, 674, A33 [CrossRef] [EDP Sciences] [Google Scholar]
- Geha, M., Blanton, M. R., Yan, R., & Tinker, J. L. 2012, ApJ, 757, 85 [Google Scholar]
- Gunn, J. E., & Gott, J. R., III 1972, ApJ, 176, 1 [Google Scholar]
- Haines, C. P., Gargiulo, A., La Barbera, F., et al. 2007, MNRAS, 381, 7 [Google Scholar]
- Haines, C. P., Pereira, M. J., Smith, G. P., et al. 2015, ApJ, 806, 101 [NASA ADS] [CrossRef] [Google Scholar]
- Haines, C., Jaffé, Y., Tejos, N., et al. 2023, The Messenger, 190, 31 [NASA ADS] [Google Scholar]
- Harris, C. R., Millman, K. J., van der Walt, S. J., et al. 2020, Nature, 585, 357 [NASA ADS] [CrossRef] [Google Scholar]
- Herpich, F. R., Almeida-Fernandes, F., Oliveira Schwarz, G. B., et al. 2024, A&A, 689, A249 [NASA ADS] [CrossRef] [EDP Sciences] [Google Scholar]
- Jiménez-Teja, Y., Román, J., HyeongHan, K., et al. 2025, A&A, 694, A216 [NASA ADS] [CrossRef] [EDP Sciences] [Google Scholar]
- Kennicutt, R. C., Jr 1983, AJ, 88, 483 [NASA ADS] [CrossRef] [Google Scholar]
- Kuchner, U., Haggar, R., Aragón-Salamanca, A., et al. 2022, MNRAS, 510, 581 [Google Scholar]
- Larson, R. B., Tinsley, B. M., & Caldwell, C. N. 1980, ApJ, 237, 692 [Google Scholar]
- Lewis, I., Balogh, M., De Propris, R., et al. 2002, MNRAS, 334, 673 [NASA ADS] [CrossRef] [Google Scholar]
- Lima, E. V. R., Sodré, L., Bom, C. R., et al. 2022, Astron. Comput., 38, 100510 [NASA ADS] [CrossRef] [Google Scholar]
- Lopes, P. A. A., Ribeiro, A. L. B., & Brambila, D. 2024, MNRAS, 527, L19 [Google Scholar]
- Lopes-Silva, V. H., Gonóalves, T. S., & Cortesi, A. 2025, ApJ, submitted [Google Scholar]
- Loubser, S. I., Mosia, K., Serra, P., et al. 2024, MNRAS, 527, 7158 [Google Scholar]
- McLachlan, G. J., Lee, S. X., & Rathnayake, S. I. 2019, Ann. Rev. Stat. Appl., 6, 355 [Google Scholar]
- Mendes de Oliveira, C., Ribeiro, T., Schoenell, W., et al. 2019, MNRAS, 489, 241 [NASA ADS] [CrossRef] [Google Scholar]
- Merloni, A., Lamer, G., Liu, T., et al. 2024, A&A, 682, A34 [NASA ADS] [CrossRef] [EDP Sciences] [Google Scholar]
- Méndez-Hernández, H., Lima-Dias, C., Lima, E. V. R., Lösch, E., & Amrutha, B. M. 2025, https://doi.org/10.5281/zenodo.17257605 [Google Scholar]
- Muldrew, S. I., Croton, D. J., Skibba, R. A., et al. 2012, MNRAS, 419, 2670 [NASA ADS] [CrossRef] [Google Scholar]
- Newman, J. A., Cooper, M. C., Davis, M., et al. 2013, ApJS, 208, 5 [Google Scholar]
- Pallero, D., Gómez, F. A., Padilla, N. D., et al. 2019, MNRAS, 488, 847 [NASA ADS] [CrossRef] [Google Scholar]
- Pandas Development Team 2020, https://doi.org/10.5281/zenodo.3509134 [Google Scholar]
- Pedregosa, F., Varoquaux, G., Gramfort, A., et al. 2011, J. Mach. Learn. Res., 12, 2825 [Google Scholar]
- Peng, Y.-J., Lilly, S. J., Kovač, K., et al. 2010, ApJ, 721, 193 [Google Scholar]
- Planck Collaboration VI. 2020, A&A, 641, A6 [NASA ADS] [CrossRef] [EDP Sciences] [Google Scholar]
- Postman, M., & Geller, M. J. 1984, ApJ, 281, 95 [Google Scholar]
- Schwarz, G. B. O., Herpich, F., Almeida-Fernandes, F., et al. 2025, Astron. Comput., 51, 100899 [Google Scholar]
- Scodeggio, M., Guzzo, L., Garilli, B., et al. 2018, A&A, 609, A84 [NASA ADS] [CrossRef] [EDP Sciences] [Google Scholar]
- Shanks, T., Metcalfe, N., Chehade, B., et al. 2015, MNRAS, 451, 4238 [NASA ADS] [CrossRef] [Google Scholar]
- Sifón, C., Finoguenov, A., Haines, C. P., et al. 2025, A&A, 697, A92 [NASA ADS] [CrossRef] [EDP Sciences] [Google Scholar]
- Sousbie, T. 2011, MNRAS, 414, 350 [NASA ADS] [CrossRef] [Google Scholar]
- Strauss, M. A., Weinberg, D. H., Lupton, R. H., et al. 2002, AJ, 124, 1810 [Google Scholar]
- Teixeira, G., Bom, C., Santana-Silva, L., et al. 2024, Astron. Comput., 49, 100886 [Google Scholar]
- Virtanen, P., Gommers, R., Oliphant, T. E., et al. 2020, Nat. Meth., 17, 261 [Google Scholar]
- Yu, G., Sapiro, G., & Mallat, S. 2010, ArXiv e-prints [arXiv:1006.3056] [Google Scholar]
- Zabludoff, A. I., & Mulchaey, J. S. 1998, ApJ, 496, 39 [Google Scholar]
- Zenteno, A., Kluge, M., Kharkrang, R., et al. 2025, A&A, 698, A171 [NASA ADS] [CrossRef] [EDP Sciences] [Google Scholar]
- Zhou, R., Newman, J. A., Mao, Y.-Y., et al. 2021, MNRAS, 501, 3309 [NASA ADS] [CrossRef] [Google Scholar]
- Zhou, R., Ferraro, S., White, M., et al. 2023, JCAP, 2023, 097 [CrossRef] [Google Scholar]
CBPF stands for Centro Brasileiro de Pesquisas Físicas.
S1502 and S1503/04 correspond to CHANCES-evolution and CHANCES-CGM sub-surveys respectively.
Efficiently Extracting Cluster candidate members with Homogeneity using Optical colour and photometric-z available at https://github.com/4MOST-CHANCES/CHANCES-EECHOz-Low-redshift-TargetSelection
Appendix A: Photo-z CBPF.
Overall and faint Low-z performance metrics for CBPF-z and LS-DR10 photo-z estimates.
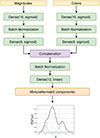 |
Fig. A.1. Architecture of the CBPF-z model used for photometric redshift estimation. The network processes magnitudes and colours through separate branches, each composed of two dense layers with sigmoid activation and batch normalisation. The outputs are concatenated and passed through additional dense and batch normalisation layers, followed by a Gaussian mixture output layer that models the redshift PDF. |
Appendix B: σNMAD polynomial fit.
σNMAD polynomial best fit coefficients.
Appendix C: Target selection figures and tables.
S-PLUS coverage. List of the 35 CHANCES Low-z clusters covered by S-PLUS.
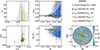 |
Fig. C.1. Similar to Figure 11 but for S-PLUS-zphot estimations including the whole mr range and assuming N × σNMAD = 3.5. |
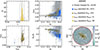 |
Fig. C.2. Similar to Figure 11 but for LS-DR9-zphot estimations including the whole mr range and assuming N × σNMAD = 3. |
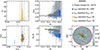 |
Fig. C.3. Same as Figure 11 but for LS-DR10-zphot estimations including the whole mr range and assuming N × σNMAD = 3. |
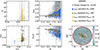 |
Fig. C.4. Similar to Figure 11 but for CBPF-zphot estimations including the whole mr range and assuming N × σNMAD = 3. |
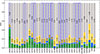 |
Fig. C.5. S1501 final individual target selection decomposition from the photometric redshift selection according to their parent survey catalogue: S-PLUS (green), LS-DR9 (light-blue), LS-DR10 (blue), LS-DR10-CBPF (yellow) and common objects (grey). Blue rectangles indicate the six clusters with good spatial and spectroscopic coverage down to mr = 20.4, while dashed-rectangles indicate clusters with S-PLUS spatial coverage > 80%. |
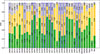 |
Fig. C.6. S1505 final individual target selection decomposition from the photometric redshift selection according to their parent survey catalogue: S-PLUS (green), LS-DR10-CBPF (yellow) and common objects (grey). Blue rectangles indicate the six clusters with good spatial and spectroscopic coverage down to mr = 20.4, while dashed-rectangles indicate clusters with S-PLUS spatial coverage > 80%. |
All Tables
Overall and faint Low-z performance metrics for CBPF-z and LS-DR10 photo-z estimates.
All Figures
|
Fig. 1. Photometric data coverage for the CHANCES Low-z sub-survey. Black circles show the CHANCES-Low-z cluster location with their corresponding 5 × R200 regions. The Horologium-Reticulum (HRS) and Shapley (SSC) superclusters regions are shown in magenta dashed boxes. The S-PLUS -DR4 and -iDR5 footprint coverage around our clusters are shown in green, while the additional CHANCES-T80S campaigns are shown in purple. The clusters with available LS-DR9 photometric redshifts are showed with dotted circles, while 51 of 50+2 clusters (except from Antlia, yellow dash-dotted circle) from our sample are covered by LS-DR10 and LS-DR10-CBPF photometric redshifts. The grey shaded region bounded by black solid lines shows Galactic latitudes |b|≤20°, while the region below the red curve corresponds to the eROSITA-DE survey (Merloni et al. 2024). |
| In the text | |
|
Fig. 2. Comparison between photometric (zphot) and spectroscopic(zspec) redshifts for each of the photo-z sets used in this work, from left to right T80S/S-PLUS, LS-DR9, LS-DR10, and LS-DR10-CBPF. Coloured symbols correspond to the bright (mr < 18.5) galaxy cluster candidate members belonging to 16 clusters with good spatial and zspec coverage for all surveys. |
| In the text | |
|
Fig. 3. σNMAD curves used to select the most likely galaxy cluster candidate members for the Low-z-CHANCES target catalogues for each set of photometric redshifts: T80S/S-PLUS (green), LS-DR9 (light-blue), LS-DR10 (blue) and LS-DR10-CBPF (yellow). The curves were obtained through a polynomial fit on the σNMAD histogram with equally log(mr) sized bins for each of the zphot training sample (see Section 3 for details), dashed lines indicate the mr-limit at which a constant value was adopted for selecting the cluster galaxy candidate members. These curves evidence the differences in mr distributions of the different training samples used to determine zphot. |
| In the text | |
|
Fig. 4. Photometric redshift as a function of r-band magnitude for each set of photometric redshifts, from left to right: T80S/S-PLUS, LS-DR9, LS-DR10, and LS-DR10-CBPF. We include the corresponding parent sample (grey circles), the A0085 galaxy cluster candidate members selected from our photometric method (blue), the spectroscopically confirmed members (yellow circles), and the confirmed spectroscopic cluster members and spectroscopic objects within the cluster redshift range (yellow crosses) that were not selected by our method. The solid black line indicates the cluster redshift obtained from the mean spectroscopic redshift distribution, while the dashed lines indicate the cluster spectroscopic redshift lower and upper limits. The bright-faint boundary at mr = 18.5 is indicated by a vertical dotted line. Adopting different zphot with their corresponding σNMAD curves lead to a different cluster galaxy candidate members selection, specially at fainter magnitudes (mr ≥ 18.5), where S-PLUS selects more candidates as compared with –zphot. |
| In the text | |
|
Fig. 5. Photometric redshift versus spectroscopic redshift for each set of photometric redshifts, from left to right: T80S/S-PLUS, LS-DR9, LS-DR10 and LS-DR10-CBPF. We include the corresponding parent sample (grey circles), the A0085 galaxy cluster candidate members selected from our photometric method (blue), the spectroscopically confirmed members (yellow circles), and the confirmed spectroscopic cluster members and spectroscopic objects within the cluster redshift range (yellow crosses) that were not selected by our method. The solid black vertical-line indicates the cluster redshift obtained from the mean spectroscopic redshift distribution, while the dashed vertical-lines indicate the cluster lower and upper limits. |
| In the text | |
|
Fig. 6. CMD for each set of photometric redshifts from left to right: T80S/S-PLUS, LS-DR9, LS-DR10 and LS-DR10-CBPF. We include the corresponding parent sample (grey circles), the A0085 galaxy cluster candidate members selected from our photometric method (blue), the spectroscopically confirmed members (yellow circles), and the confirmed spectroscopic cluster members and spectroscopic objects within the cluster redshift range (yellow crosses) that were not selected by our method. The bright-faint boundary at mr = 18.5 is indicated by a vertical dotted line. The different CMDs evidence the out-striking differences of the selected cluster galaxy candidate members, specially at fainter magnitudes (mr ≥ 18.5), where only T80S/S-PLUS- and LS-DR10-CBPF-zphot effectively populate the red faint regime (mg − mr > 0.5). |
| In the text | |
|
Fig. 7. Spatial distribution of the A0085 galaxy cluster candidate members using our target selection process for the four different parent catalogues used, from left to right: T80S/S-PLUS, LS-DR9, LS-DR10 and LS-DR10-CBPF. We include the corresponding parent sample(grey circles), the A0085 galaxy cluster candidate members selected from our photometric method (blue), the spectroscopically confirmed members (yellow circles), and the confirmed spectroscopic cluster members and spectroscopic objects within the cluster redshift range (yellow crosses) that were not selected by our method. The cluster galaxy candidate members of the four different zphot are homogeneously distributed and any significant differences are appreciated. |
| In the text | |
|
Fig. 8. Total number of selected objects (NT) for the faint-end (mr ≥ 18.5) regime by adopting different N × σNMAD combinations for T80S/S-PLUS and LS-DR10-CBPF galaxy cluster candidate members selection and imposing different mr-limit values (20, 20.1, 20.2, 20.3, 20.4 and 20.5). The lower panel show a set of 5 different N × σNMAD combinations within the mr range of 20-20.5. The leftmost column of each set corresponds to target selections adopting N × σNMAD = 4 for both T80S/S-PLUS and LS-DR10-CBPF, followed by the N × σNMAD combinations (from left to right): 3.5/3.0, 3.5/2.5, 3.0/2.5; and 3.0/2.0 for T80S/S-PLUS and LS-DR10-CBPF respectively. As a reference NT number (NT) of selected objects is included on top of each mr-limited set considering N × σNMAD = 4 for both T80S/S-PLUS and CBPF surveys. The blue line highlights how NT varies as a function of mr, if mr = 20.5 (N/NT = 1) is considered NT is reduced to 60% at mr-limit = 20. Each bar is decomposed by their corresponding parent survey catalogue: T80S/S-PLUS (green), CBPF (yellow) and common objects selected by both surveys(grey). The upper panel shows how the different N × σNMAD adopted combinations for T80S/S-PLUS and LS-DR10-CBPF affect NT at each mr-limit bin, considering N × σNMAD = 4 as a reference (N/NT = 1). At all mr bins the number of objects is reduced for the different N × σNMAD combinations, dropping down to a ≲60% of the selected objects at N × σNMAD-combination: 3.0, 2.0 for T80S/S-PLUS and LS-DR10-CBPF, respectively. The final mr-limit at = 20.4 and N × σNMAD-combination 3.5/T80S/S-PLUS and 3.0/ LS-DR10-CBPF adopted to compile the Low-z faint (S1505) and Low-z faint suplementary (S1506) catalogues is highlighted in red. |
| In the text | |
|
Fig. 9. Number of galaxy cluster candidate members selected photometrically (top) and the fraction of lost spectroscopically confirmed members normalised to N × σNMAD = 1 (bottom) as a function of N × σNMAD considering the CHANCES low-redshift magnitude-limited regimes: bright end (mr < 18.5, red) and faint end (mr ≥ 18.5, blue). Assuming N × σNMAD = 4 our target selection process selects the largest number of galaxy cluster candidate members with the lowest fraction loss of spectroscopic members, while assuming N × σNMAD = 1 we select the lowest number of galaxy cluster candidate members, with the highest fraction of lost spectroscopically confirmed members. The first panel shows this by considering only our internal LS-DR10-CBPF-zphot estimations, while the middle and right panels show a direct comparison between LS-DR10-CBPF- and S-PLUS-zphot, considering 10 clusters with good T80S/S-PLUS coverage (middle panel) and an extended sample considering 16 clusters with T80S/S-PLUS coverage >80%(rightmost panel); see Section 2.3 for details. Assuming N × σNMAD = 3.5 and 3 for S-PLUS and LD-DR10-CBPF-zphot, respectively, successfully reduces the total number of the galaxy cluster candidate members selected with a spectroscopic members loss of ∼2 − 3%. |
| In the text | |
|
Fig. 10. CHANCES-Low-z photometric selection diagram showing the different survey datasets used to compile the Low-z bright (S1501), Low-z faint (S1505) and Low-z faint supplementary (S1506). The T80S/S-PLUS, LS-DR9, LS-DR10 and LS-DR10-CBPF datasets are shown in green, cyan, blue and yellow, the red circle represents the ±1σ red sequence selected objects. |
| In the text | |
|
Fig. 11. Photometric target selection of Abell 500 for bright objects (mr < 18.5) using T80S/S-PLUS-zphot. grey symbols correspond to the T80S/S-PLUS photometric parent sample, yellow symbols correspond to the spectroscopic objects, while blue symbols correspond to the photometric selected Abell 500 galaxy cluster candidate members. The upper panels show from left to right, the spectroscopic redshift distribution(zspec), the mr − zphot diagram and relevant cluster information including the parent sample, total number of galaxy cluster selected objects, the spectroscopically confirmed cluster members (yellow circles), the confirmed spectroscopic cluster members (open circles), and the spectroscopically confirmed cluster members and spectroscopic objects within the cluster redshift range (yellow crosses) that were not selected by our method. The lower panels show from left to right show the zspec − zphot diagram, along with the CMD and spatial distribution diagram (SDD). |
| In the text | |
|
Fig. 12. Red sequence fit from the CMD for Abell 85. The left panel shows the CMD, the grey points correspond to the galaxy cluster candidate members selected by our photometric method, the open coloured symbols show the colour-range bins used to fit the red sequence, yellow stars correspond to the mean mg − mr colour in each bin obtained from a gaussian fit, while the best fit is shown with a black solid line including the ±1σ region in red and delimeted by dotted lines. The dashed line indicates the bright-faint boundary at mr = 18.5. The right panel shows the mg − mr bins distributions, overlaid in black lines show the best guassian fit for each distribution while the dashed lines indicated the mean average mg − mr colour. |
| In the text | |
|
Fig. 13. Photometric target selection of Abell 500, using CBPF-zphot, including the red sequence objects. The red-faint objects from S1506 completely fill the under-dense region in the faint-red-end and are homogenously distributed out to 5 × R200. Similar as Figure 11 symbols represent the parent sample, spectroscopic objects and the photometric selected Abell 500 galaxy cluster candidate members in grey, yellow and blue respectively. We now include in magenta symbols the faint-red objects added through the faint-red sequence fit (see Section 3.2 for details). The upper panels show from left to right, the spectroscopic redshift distribution(zspec), the zphot − mr diagram and relevant cluster information including the parent sample, total number of galaxy cluster selected objects, the confirmed spectroscopic cluster members (open circles), and the spectroscopically confirmed cluster members and spectroscopic objects within the cluster redshift range (yellow crosses) that were not selected by our method. The lower panels show from left to right the zspec − zphot diagram, along with the CMD and SSD. The red sequence-fit selected objects successfully fill in the faint-end, under-dense region and are homogenously distributed within 5 × R200. |
| In the text | |
|
Fig. 14. Left panel: LSS and substructures identification in A3376. Blue colour bar shows the local galaxy density with KNN of photometric members that are part of the cluster. Yellow squares are the spectral members. The identified filaments are represented as red lines, where nodes are indicated as black dots. Green circumference is 5 × R200. Magenta contours are eROSITA large-scale X-ray detections in the cluster area. The identified substructures are plotted with different colours. Right panel: RGB cutout of A3376 the central region (0.5 × R200, dashed circle ), overlaid their corresponding galaxy cluster candidate members from S1501 (blue open plus symbols), S1505 (red open cross symbols) and the brightest cluster galaxy (BCG, white star) can be found. |
| In the text | |
|
Fig. A.1. Architecture of the CBPF-z model used for photometric redshift estimation. The network processes magnitudes and colours through separate branches, each composed of two dense layers with sigmoid activation and batch normalisation. The outputs are concatenated and passed through additional dense and batch normalisation layers, followed by a Gaussian mixture output layer that models the redshift PDF. |
| In the text | |
|
Fig. C.1. Similar to Figure 11 but for S-PLUS-zphot estimations including the whole mr range and assuming N × σNMAD = 3.5. |
| In the text | |
|
Fig. C.2. Similar to Figure 11 but for LS-DR9-zphot estimations including the whole mr range and assuming N × σNMAD = 3. |
| In the text | |
|
Fig. C.3. Same as Figure 11 but for LS-DR10-zphot estimations including the whole mr range and assuming N × σNMAD = 3. |
| In the text | |
|
Fig. C.4. Similar to Figure 11 but for CBPF-zphot estimations including the whole mr range and assuming N × σNMAD = 3. |
| In the text | |
|
Fig. C.5. S1501 final individual target selection decomposition from the photometric redshift selection according to their parent survey catalogue: S-PLUS (green), LS-DR9 (light-blue), LS-DR10 (blue), LS-DR10-CBPF (yellow) and common objects (grey). Blue rectangles indicate the six clusters with good spatial and spectroscopic coverage down to mr = 20.4, while dashed-rectangles indicate clusters with S-PLUS spatial coverage > 80%. |
| In the text | |
|
Fig. C.6. S1505 final individual target selection decomposition from the photometric redshift selection according to their parent survey catalogue: S-PLUS (green), LS-DR10-CBPF (yellow) and common objects (grey). Blue rectangles indicate the six clusters with good spatial and spectroscopic coverage down to mr = 20.4, while dashed-rectangles indicate clusters with S-PLUS spatial coverage > 80%. |
| In the text | |
Current usage metrics show cumulative count of Article Views (full-text article views including HTML views, PDF and ePub downloads, according to the available data) and Abstracts Views on Vision4Press platform.
Data correspond to usage on the plateform after 2015. The current usage metrics is available 48-96 hours after online publication and is updated daily on week days.
Initial download of the metrics may take a while.